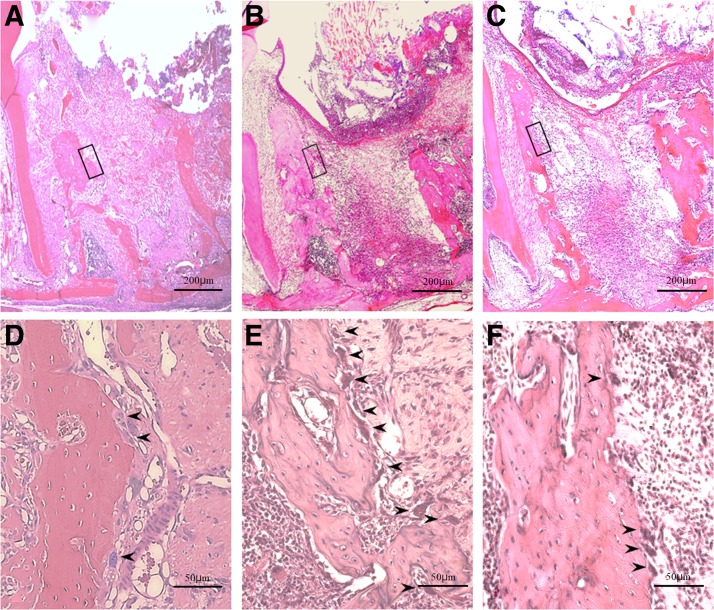
FIG. 4.
Histopathology on day 3 after tooth extraction. (A–C) Entire extraction socket, original magnification × 40. (D–F) Enlargement of areas indicated by the dotted line in (A–C), original magnification × 100. (A, D) Diode group; (B, E) CO2 group; (C, F) control group. Arrowheads (➤) indicate osteoclast-like cells. Progression of organization from socket surroundings is seen with blood clot only at the center in the laser treatment groups (A, B). In contrast, the socket is almost completely filled with a blood clot in the control group (C). Near absence of osteoclast-like cells with rapid organization in the diode group (D). Numerous osteoclast-like cells and active bone resorption in the CO2 group (E). Few osteoclast-like cells are seen in the control group (F).

