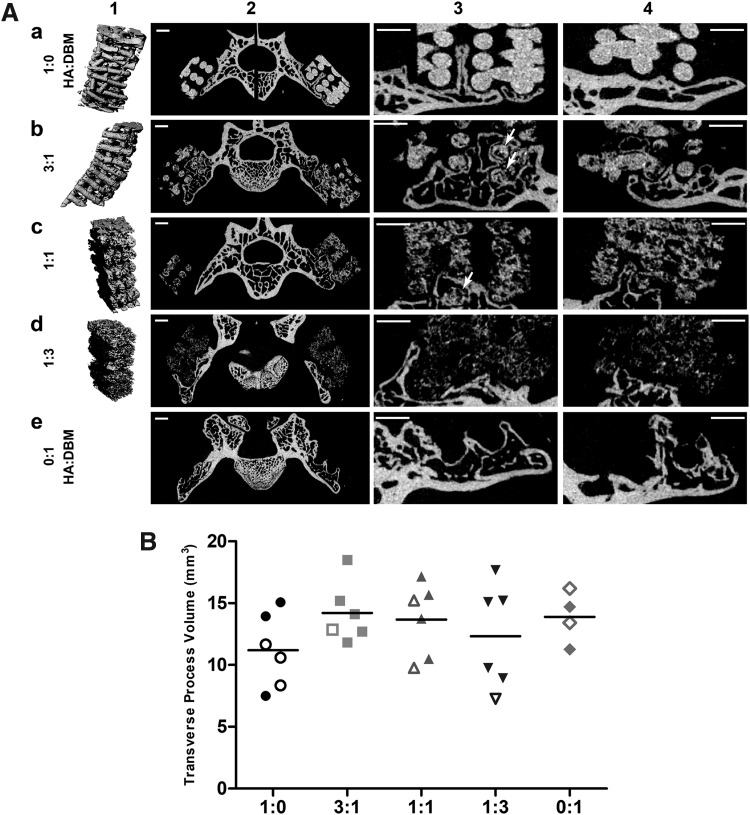
FIG. 3.
Laboratory microCT. (A) Laboratory microCT images 8 weeks postoperative. Each row (a–e) corresponds to a different scaffold type. Column 1 shows 3D renderings of the respective scaffolds, column 2 shows slices covering the entire spine, column 3 shows an enlarged area around one of the transverse processes from column 2, and column 4 shows an enlargement of a different slice. The lighter the pixel in columns 2–4, the more heavily attenuating the corresponding voxel. Column 3 symbols are identified in the text. Scale bars = 1 mm. (B) Laboratory microCT measurement of the volume of bilateral L4 and L5 transverse processes, which includes new bone growth into the scaffolds. Closed symbols denote spines scored as fused and open symbols unfused spines. microCT, microcomputed tomography.

