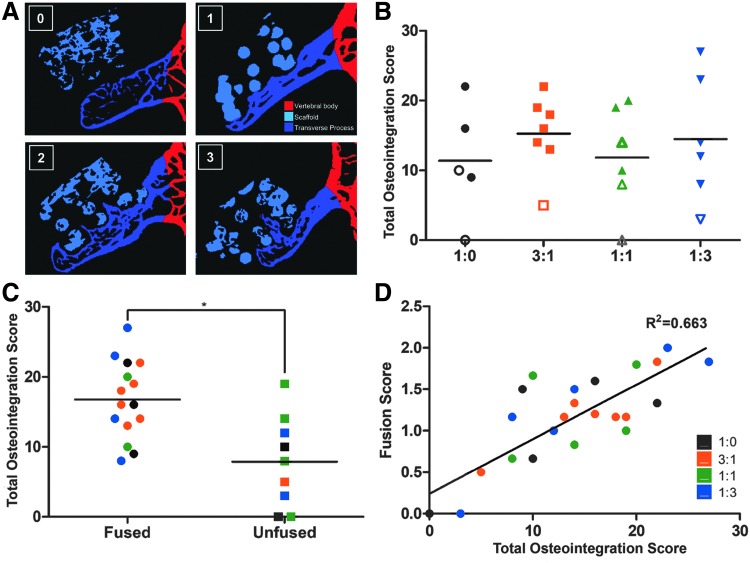
FIG. 4.
Laboratory microCT quantification of osteointegration and comparison with fusion scores. (A) Representative segmented microCT slices illustrating the osteointegration scoring system, with the synthetic HA particles segmented cyan, the transverse processes and bone growing from them labeled blue, and all other bones shown in red. Each side of the spine was scored separately on a 0–3 scale (labels for each score in the upper left corner of each image): 0: no bone growth beyond the proximal (ventral) surface of scaffold; 1: bone growth beyond the proximal surface, but not beyond the first scaffold strut; 2: bone growth beyond the first scaffold strut, but not the second; and 3: bone growth beyond the second scaffold strut. All the slices covering a scaffold were examined, with the highest score observed assigned to that scaffold. (B) Total osteointegration scores. Three regions within each scaffold were scored separately for each TP: the medial end of the scaffold (the “medial endcap,” adjacent to the vertebral body), the scaffold body, and the lateral end of the scaffold (the “lateral endcap”). Scores from each region were summed to generate a total ingrowth score. Solid and hollow markers denote fused and unfused spines, respectively. (C) Fused spines averaged a significantly greater total osteointegration score relative to unfused spines (p < 0.01). (D) Total osteointegration score versus manual palpation-based fusion score. Linear regression shows a correlation R2 = 0.663, with a slope significantly different than 0 (p < 0.001).

