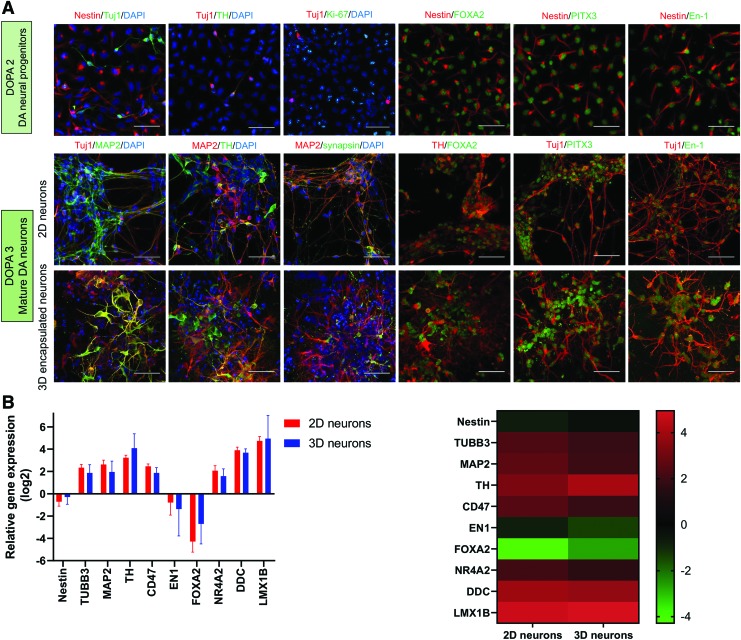
FIG. 2.
Characterization of DA neural progenitors and DA neurons. (A) Immunocytochemical staining of the following markers: Nestin: neural stem/progenitor, Tuj1 (β-III tubulin): neuron, MAP2: mature neuron, TH: DA neuron, Ki-67: proliferative cells, Synapsin: synaptic vesicle, FOXA2: midbrain DA neuron, PITX3: midbrain DA neuron, En-1 (Engrailed-1): midbrain DA neuron, DAPI: nucleus. Scale bar: 50 μm. (B) qRT-PCR analysis comparing gene expression in 2D and 3D (SAPNS-encapsulated) DA neurons at day 22 of differentiation. Data are presented as log2 of the fold change in expression relative to DOPA2 neural progenitors, shown in a bar graph (left) and heat map (right). Error bars represent standard deviation. p > 0.05, Student's unpaired t-test. 2D, two-dimensional; 3D, three-dimensional; qRT-PCR, quantitative reverse transcription-polymerase chain reaction; TH, tyrosine hydroxylase. Color images are available online.

