FIG. 3.
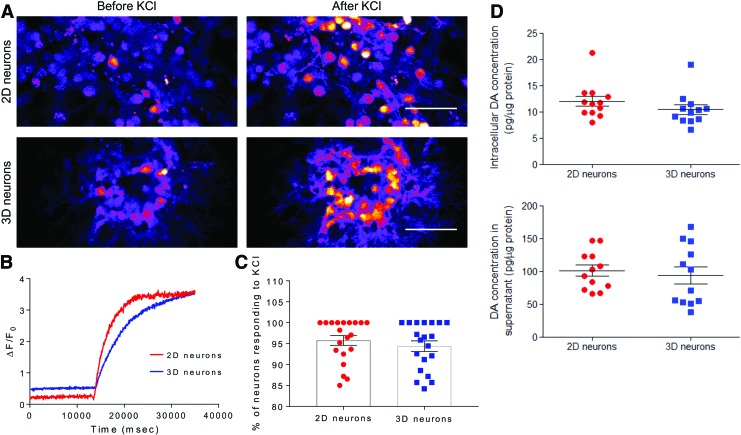
SAPNS supports the functional maturation of encapsulated neurons. (A) Still images from time lapse videos during live cell calcium imaging before and after the addition of high KCl buffer. Scale bar: 50 μm. (B) Representative plot of the change in fluorescence compared with baseline fluorescence (ΔF/F0). (C) Quantification of the percentage of neurons in 2D and 3D responding to the addition of high KCl buffer (100 mM). Data are presented as mean ± SEM. p > 0.05, Student's unpaired t-test. (D) HPLC-ECD quantification of DA present intracellularly and in 24-h conditioned medium, normalized to the mass of protein present. Data are presented as mean ± SEM. p > 0.05, Student's unpaired t-test. HPLC-ECD, high performance liquid chromatography-electrochemical detection; SEM, standard error of the mean. Color images are available online.

