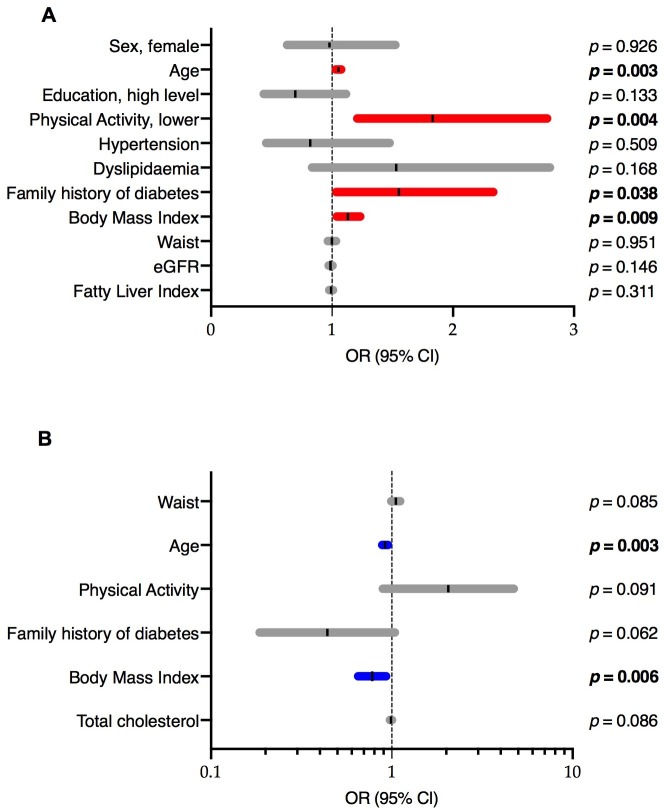
Figure 2.
Multivariate logistic regression models: (a) Model of pre-diabetes versus normoglycaemic state in the Mollerussa cohort at baseline. Significant p values are shown in BOLD. Hosmer-Lemeshow test p=0.295. (b) Model of normalised versus persisted in subjects with follow-up data. Significant p values are shown in BOLD. Hosmer-Lemeshow test p=0.931. eGFR, estimated glomerular filtration rate.

