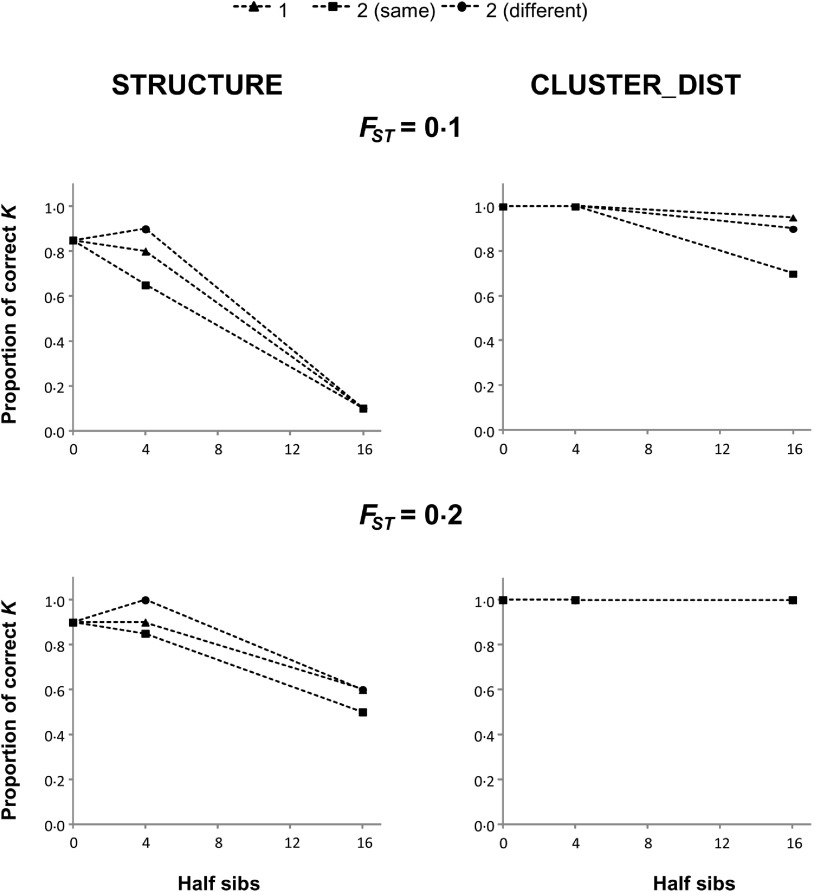
Fig. 3.
Proportion of replicates where STRUCTURE (left panels) and CLUSTER_DIST (right panels) infer K = 3 when n = 3 in the presence of half-siblings, using 10 microsatellites. Triangles represent one family, squares indicate two families in the same subpopulation, and circles represent two families in different subpopulations.

