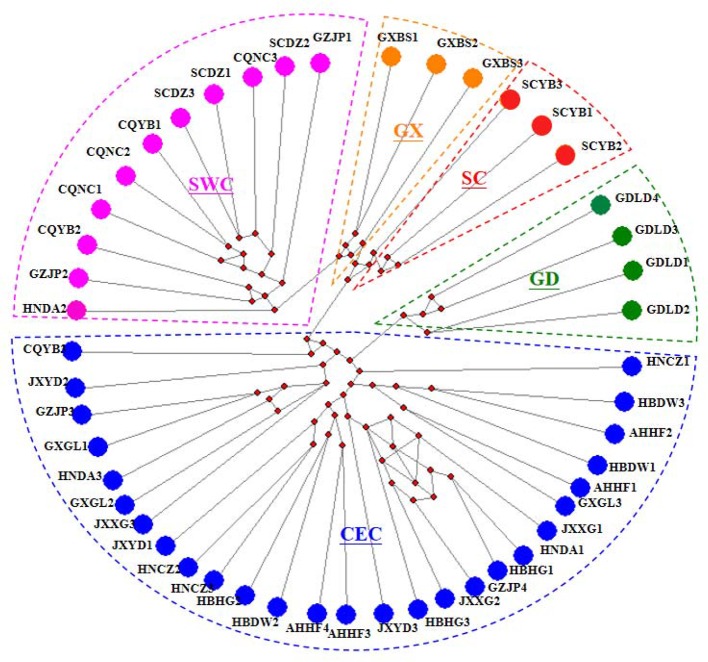
Figure 1.
Median-Joining network based on the whole mitochondrial DNA (mtDNA). Each circle represents a haplotype and next to the haplotype is the populations to which the haplotype belongs. Different colored areas in the dotted line correspond to different subgroups. The little red dots in the middle of the circle represent the mutational nodes.

