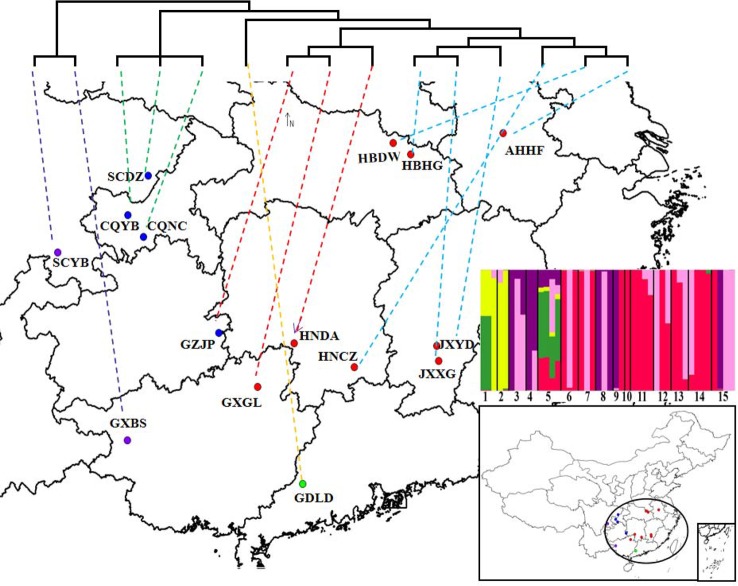
Figure 5.
The locations of sampling specimens of Dendrolimus punctatus. A simplified maximum likelihood (ML) tree based on mtDNA is shown at the top of the figure. Lower-right insert shows the best genetic clustering (K = 5) based on SNPs of the whole mtDNA. The populations represented by numbers 1~15 in turn are: GXBS, SCYB, CQNC, CQYB, GDLD, HNCZ, HBDW, HNDA, SCDZ, AHHF, GXGL, HBHG, JXXG, JXYD, and GZJP.

