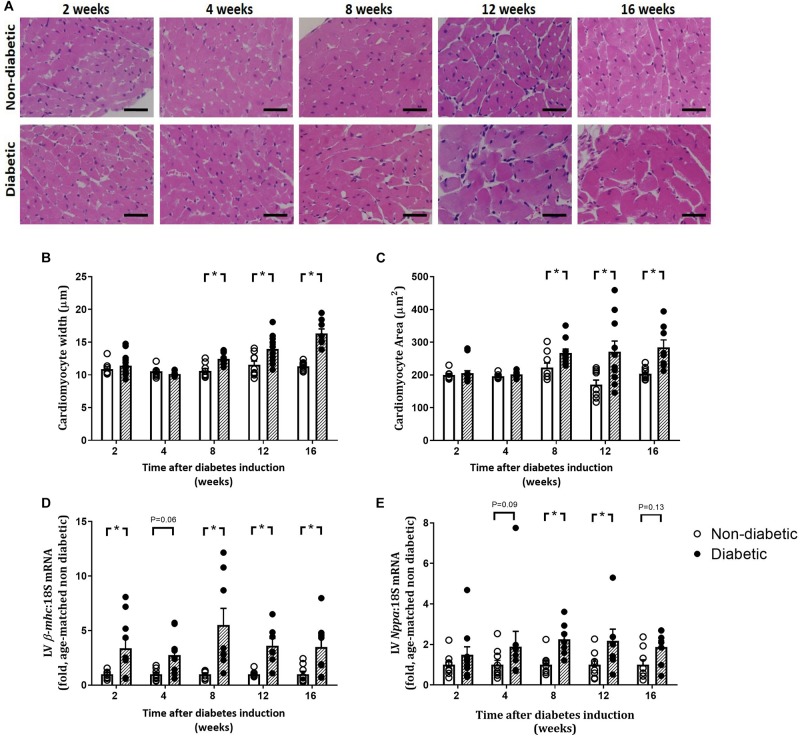
FIGURE 5.
Progression of cardiomyocyte hypertrophy. Cardiomyocyte width and area, from H&E-stained LV sections (A–C), gene expression of hypertrophic markers β-myosin heavy chain, β-mhc (D) and Nppa (E) are shown. Data are presented as mean ± SEM. *P < 0.05 vs age-matched non-diabetic mice (two-way ANOVA with Benjamini and Hochberg post hoc test). Representative H&E images (A) for each endpoint are shown. Scale bar = 20 μm. n = 7–15/group (refer to Supplementary Figure S1).

