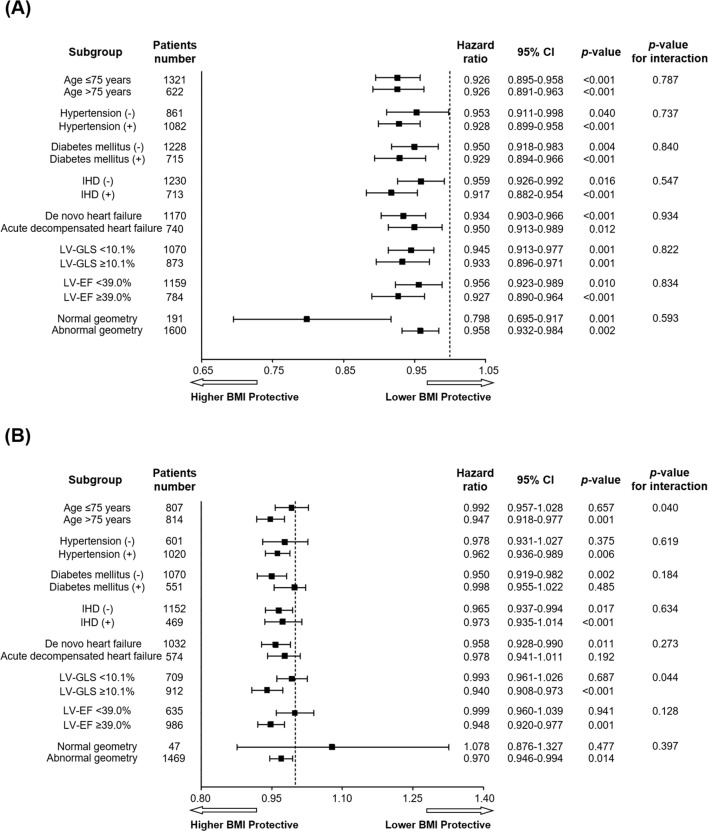
Figure 3.
Forest plots of adjusted HRs for the relationship of BMI, per 1 kg/m2 increment as a continuous variable, with all-cause mortality in men (A) and women (B). The HR within each stratum was adjusted for the independent variables shown in table 2. BMI, body mass index; EF, ejection fraction; GLS, global longitudinal strain; LV, left ventricle

