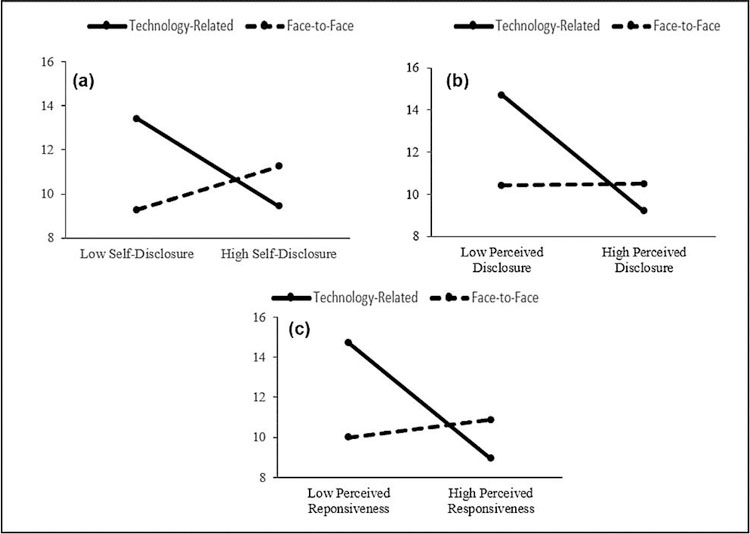
Figure 2.

The three graphs in figure 2 represent the interaction of relational processes (a) self-disclosure, (b) perceived support member disclosure, (c) perceived support member responsiveness and mode of communication on depressive symptoms. The dashed line represents non-significant simple slopes.
