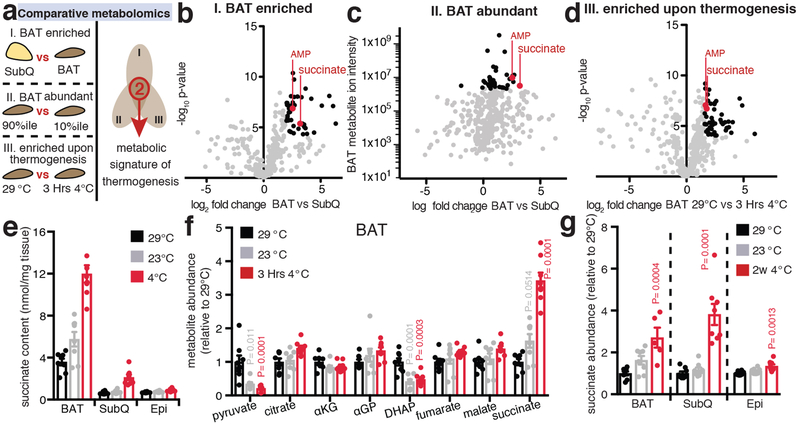
Figure 1: Selective accumulation of succinate is a metabolic signature of adipose tissue thermogenesis.
a-d, (a) Comparative metabolomics strategy. Annotated metabolites (grey), metabolites fulfilling each individual criterion (black), metabolites fulfilling all criteria (red). BAT enriched metabolites in (b) were defined as fold change > 4 and −log10p > 4 versus subcutaneous inguinal adipose tissue (SubQ). Abundant BAT metabolites in (c) were defined as those within the 10% most abundant annotated metabolite ion intensities, although abundance determination in this way is not absolute, as ion intensity can vary between species on the basis of factors other than abundance. BAT metabolites enriched upon activation of thermogenesis by exposure to 4°C for 3 Hrs in (d) were defined as fold change > 3 and −log10p > 4 versus BAT in mice housed at 29°C (n = 8). e, Absolute succinate content in adipose tissues (n = 8). BAT 3 Hrs at 4°C, SubQ and epididymal (Epi) 2w at 4°C. f, Abundance of mitochondrial and proximal metabolites in BAT at 29°C, 23°C, and 3 Hrs exposure to 4°C (n = 8). g, Abundance of succinate in BAT, SubQ, and Epi comparing 29°C to 2 weeks 4°C exposure (n = 8; 2w 4°C BAT n = 5). b-d, univariate two-sided t-test; f,g, one-way ANOVA; data are mean of biologically independent samples ± s.e.m.

