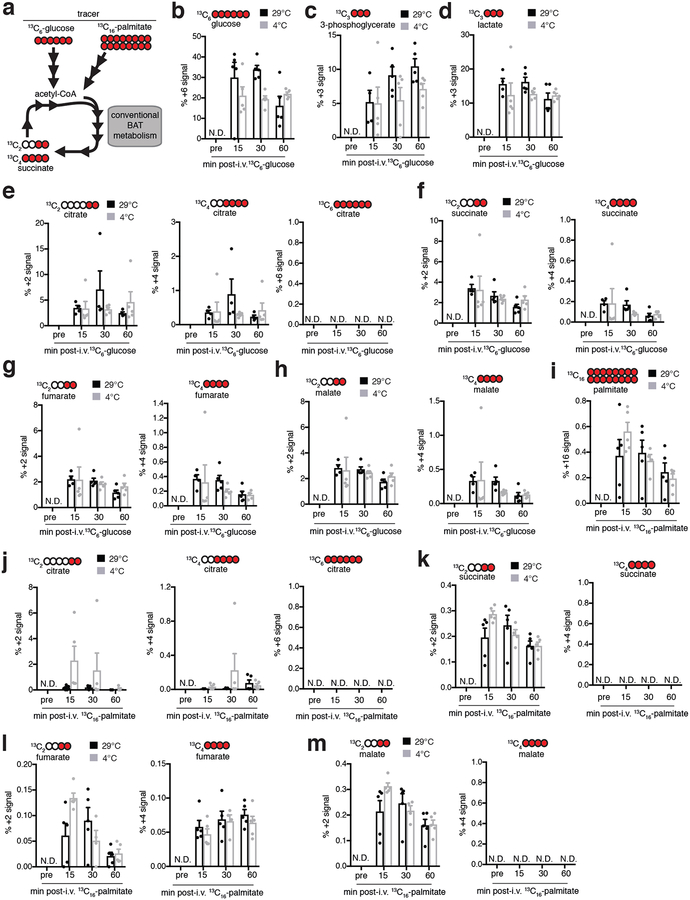
Extended Data Figure 3: 13C isotopologue labelling of glucose and TCA cycle metabolites in mouse BAT following i.v. 13C-glucose at 29°C or 4°C.
a, Potential inputs to succinate-directed flux by conventional BAT metabolism and 13C-metabolite labelling strategy. Mice were administered (b-h) [U-13C]-glucose or (i-m) [U-13C]-palmitic acid i.v. as a bolus at 29°C or 4°C followed by BAT harvesting and snap freezing for LC-MS analysis at indicated time-points. b, Proportional isotopic labelling of BAT glucose. c,d, Proportional isotopic labelling profile of glycolytic metabolites (c) 3-phosphoglycerate and (d) lactate in mouse BAT. e-h, Proportional isotopic labelling profile of TCA cycle metabolites (e) citrate, (f) succinate, (g) fumarate, and (h) malate in mouse BAT. i, Proportional isotopic labelling of BAT palmitate. h-k, Proportional isotopic labelling profile of TCA cycle metabolites (j) citrate, (k) succinate, (l) fumarate, and (m) malate in BAT. (n = 5). Missing values or N.D. indicate value not determined. Data are mean of biologically independent samples ± s.e.m.

