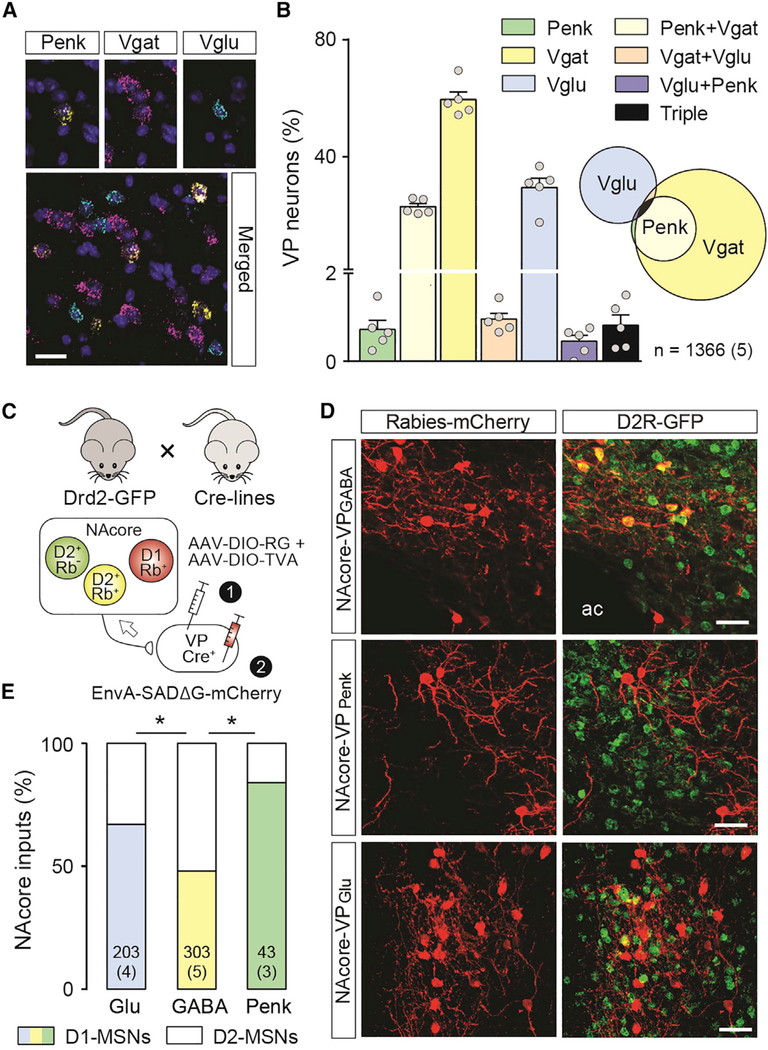
Figure 1. Relative Density of VP Neuronal Subtypes and Proportion of Inputs Derived from NAcore D1- and D2-MSNs.
(A) Representative micrograph from the VP showing triple in situ hybridization of mRNA encoding Vglut2 (Slc17a6; turquoise), Penk (yellow), Vgat (slc32a1; pink), and a DAPI nuclear counterstain. Scale bar, 25 μm.
(B) Relative density of the combinations of Vglut2, Penk, and Vgat expression in VP neurons, shown both as a percentage of each cell type in a bar graph and in a proportional Venn diagram. n = cell number over (mouse number).
(C) Reporter mice used to characterize neurons upstream of the distinct VP populations as D1-MSNs (D2-GFP−) or D2-MSN (D2-GFP+) were generated by crossing Drd2-GFP mice with Vglut2, Vgat, and Penk Cre mouse lines (top). Helper viruses introduced rabies G-protein and the avian sarcomavirus leukosis receptor A (TVA) into distinct VP starter cells, followed by pseudotyped replication-deficient rabies.
(D) Representative micrographs showing rabies-infected D1-MSN (red) and D2-MSN (yellow) in the NAcore. Scale bar, 25 μm.
(E) VPGlu and VPPenk neurons are preferentially innervated by D1-MSN. n in bars = cell number over (mouse number).
Data in bars are presented as mean ± SEM. Chi-square tests with Bonferroni-adjusted p values for repeated testing. *p < 0.05.

