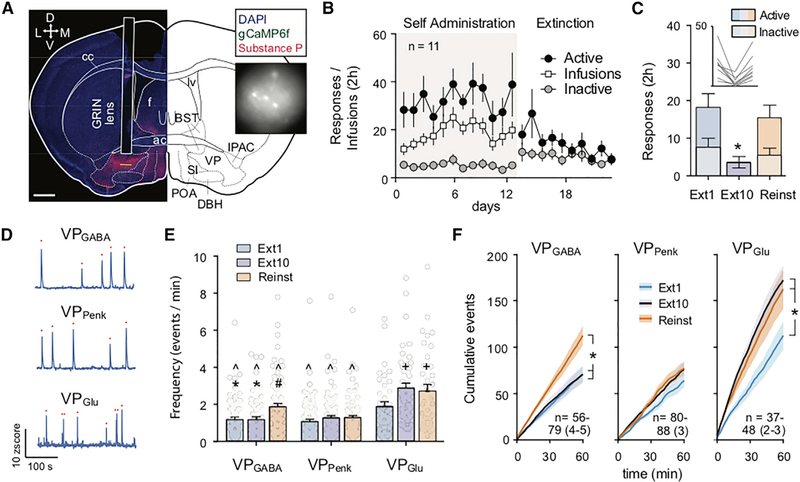
Figure 4. Miniscope Measurements of Single-Cell Ca2+ Spikes in VP during Extinction and Cue-Induced of Cocaine Seeking.
(A) Representative micrograph of GRIN lens implantation site in a Vglut2-IRES-Cre mouse above VP to record from VPGlu neurons expressing gCaMP6f. Inset shows example frame from miniature microscope video. BST, bed nucleus of the stria terminalis; cc, corpus callosum; DBH, diagonal horizontal band of Broca; f, fornix; ic, interior commissure; IPAC, interstitial nucleus of the posterior anterior commissure; lv, lateral ventricle; POA, preoptic area; SI, substantia innominata. Scale bar, 700 μm.
(B) Self-administration of cocaine (with dummy camera) and extinction training in all mice.
(C) Active and inactive nose pokes made in all mice used for Ca2+ imaging during Ext1, Ext10, and Reinst. * p < 0.05 comparing Ext10 to Ext1 and Reinst.
(D) Representative traces showing calcium events recorded from VPGABA, VPPenk, and VPGlu neurons. Red dots indicate registered Ca2+ events.
(E) Comparisons between the average event rate across cell types and sessions. Comparisons between cell types revealed that VPGlu neurons display a significantly higher Ca2+ event rate across all conditions compared with VPGABA and VPPenk neurons and that the VPGABA Ca2+ event rate is elevated compared with VPPenk during Reinst. Comparisons within cell types showed that extinction learning increases the frequency of Ca2+ events in VPGlu (Ext1 versus Ext10 and Reinst), while Reinst selectively increases the Ca2+ event rate of VPGABA (Reinst versus Ext1 and Ext10).
*p < 0.05 compared with cue seeking within cell group, +p < 0.05 compared with Ext1 within cell group, ^p < 0.05 compared with VPGlu neurons in the same session, and #p < 0.05 compared with VPPenk in the same session. (F) Cumulative spikes across the 2 h recording session. n = cell number per session over (mouse number). *p < 0.05 comparing between sessions. All data are presented as mean ± SEM.

