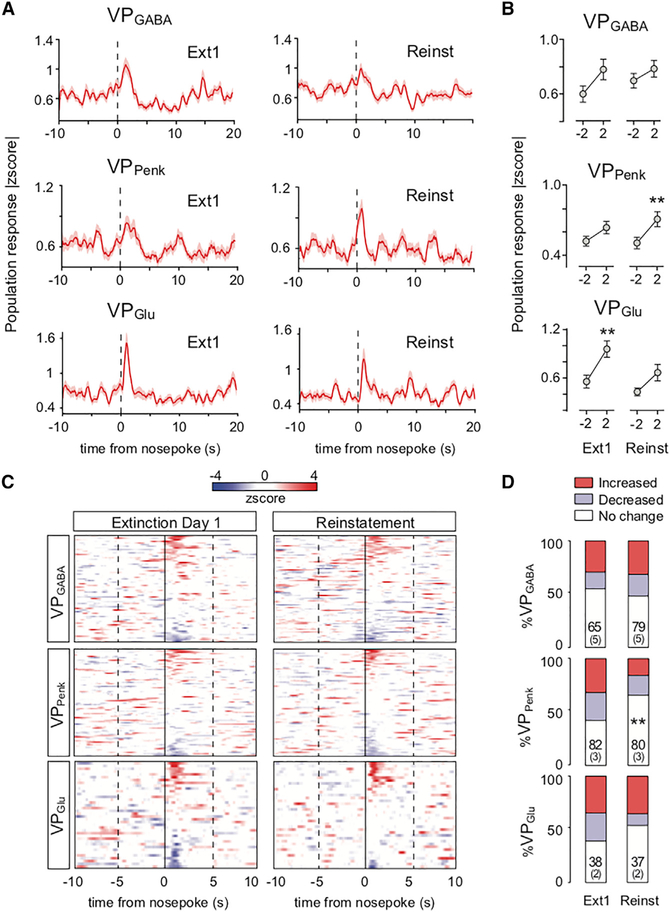
Figure 5. VP Subpopulations Show Distinct Patterns of Calcium Fluorescence Organized around Nose Pokes.
(A) Peri-event histograms showing the normalized absolute change in population response magnitude for all VP neurons during Ext1 and Reinst before and after active nose pokes.
(B) Comparisons of the change in population activity between −2 s before and 2 s after a nose poke during Ext1 and Reinst. Changes in VPGABA population calcium fluorescence were not significantly different around nose pokes during Ext1 or Reinst, VPPenk population activity was altered around nose pokes during Reinst, and VPGlu population activity changed around nose pokes during Ext1. **p < 0.01 comparing −2 s with 2 s around nose pokes.
(C) Overview of peri-event histograms showing distinct response patterns in each cell type during nose pokes, organized by activation or inhibition (increases in fluorescence are shown in red and decreases in fluorescence in blue).
(D) Population fractions of neurons with significantly (>2 SD) increased or decreased activity at 0–2 s following a nose poke. A smaller fraction of VPPenk neurons was recruited during Reinst compared with Ext1.
n = cell number per session over (mouse number). Chi-square test. **p < 0.01 comparing fractions of activity patterns between Ext1 and Reinst. All data are presented as mean ± SEM.

