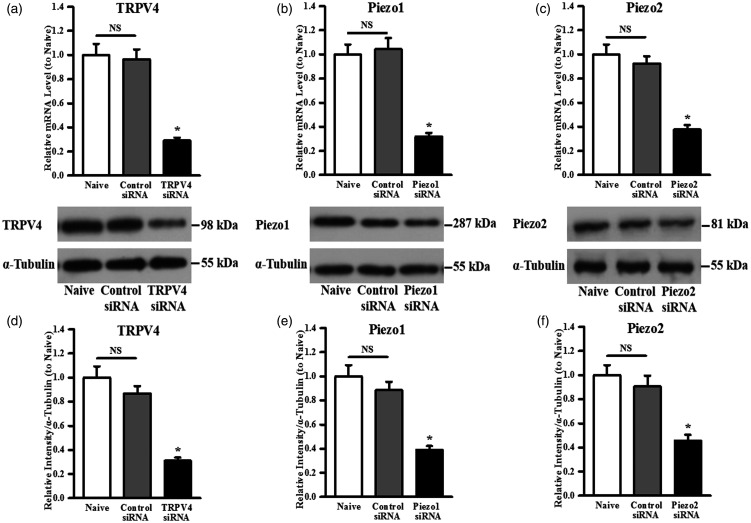
Figure 3.
Quantitative analysis of (a) TRPV4/(b) Piezo1/(c) Piezo2 mRNA levels by real-time PCR in untreated cells (naive) and cells treated with control siRNA or TRPV4/Piezo1/Piezo2 siRNA, respectively. Representative Western blot image for (d) TRPV4/(e) Piezo1/(f) Piezo2 channel protein expression. Quantitative analysis based on densitometry using Image-Pro Plus by comparing to the housekeeping protein α-tubulin showing the specific knockdown of the expression of (g) TRPV4/(h) Piezo1/(i) Piezo2. Data are presented as percentage of naive cells and the mean ± standard deviation of three independent experiments. *P < 0.05, TRPV4, Piezo1, or Piezo2 siRNA vs. control siRNA.
NS: non-significant; TRPV4: transient receptor potential vanilloid 4.

