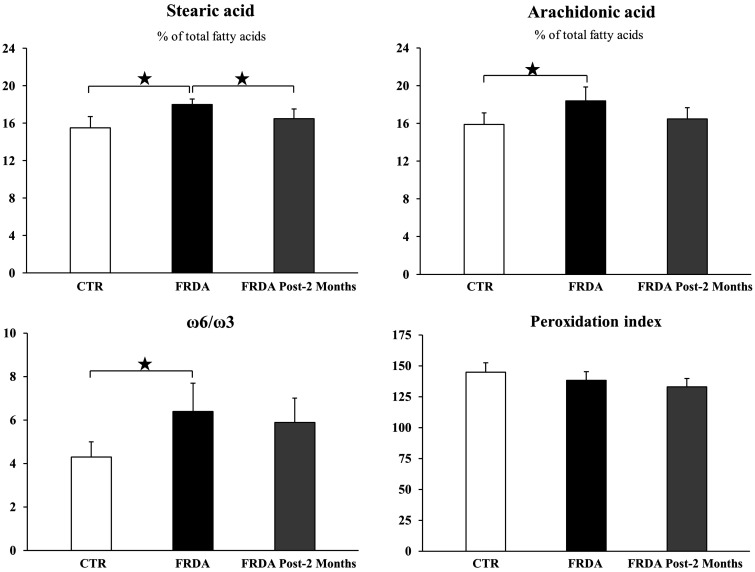
Figure 5.
Relevant lipidomic parameters (Mean ± SD) from healthy control volunteers (CTR) and from FRDA patients before (FRDA) and after two month (FRDA post-2 months) tocotrienol supplementation. The content of individual fatty acids in erythrocyte membranes is expressed as percentages of the total fatty acids identified. Significance was evaluated by ANOVA; significance was not maintained for stearic acid after P value false discovery rate (FDR) correction. Stars show statistical significance for relevant Student’s two-tailed t test comparisons: (*) P < 0.05; (**) P < 0.01.

