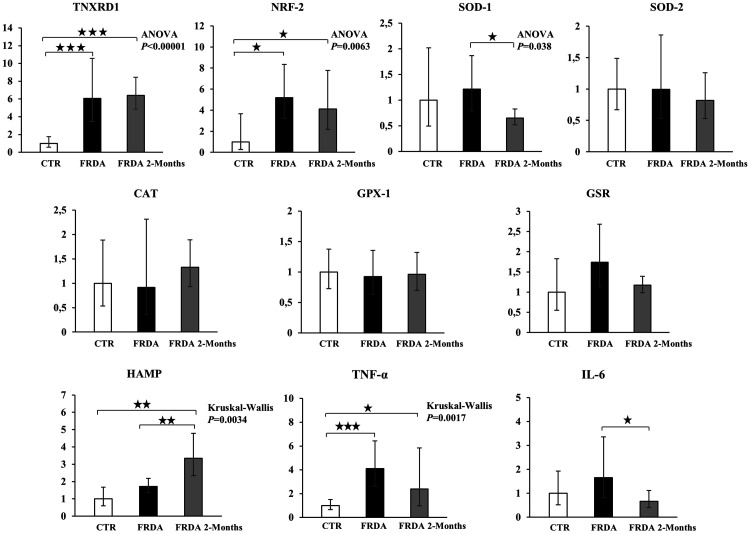
Figure 6.
Messenger RNA expression of antioxidant and inflammation genes in mononuclear white blood cell extracts from healthy control subjects (CTR) and FRDA patients before (FRDA) and after (FRDA Post-2 Months) two months of tocotrienol by qPCR. Thioredoxin Reductase 1, (TNXRD1); Nuclear Factor, Erythroid 2 like 2 (NRF-2); Superoxide Dismutase-1 (SOD-1); Superoxide Dismutase-2 (SOD-2); Catalase (CAT); Glutathione Peroxidase (GPX-1); Glutathione Reductase (GSR); Hepcidin (HAMP); Tumor Necrosis Factor-alpha (TNF-α); Interleukin-6 (IL-6). Data were normalized with two housekeeping genes, Beta-Actin and GAPDH. For each gene, the normalized expression value of CTR was set to 1, and the other gene expression data were reported to that sample. Data are expressed as fold change ± confidence interval (CI). Parametric analysis was applied for all genes except for GPX-1, HAMP, and TNF-α, which were analyzed by non-parametric methods. Significance was maintained after P value FDR correction, except for SOD-1. Stars show statistical significance for relevant comparisons: (*) P < 0.05; (**) P < 0.01; (***) P < 0.001.

