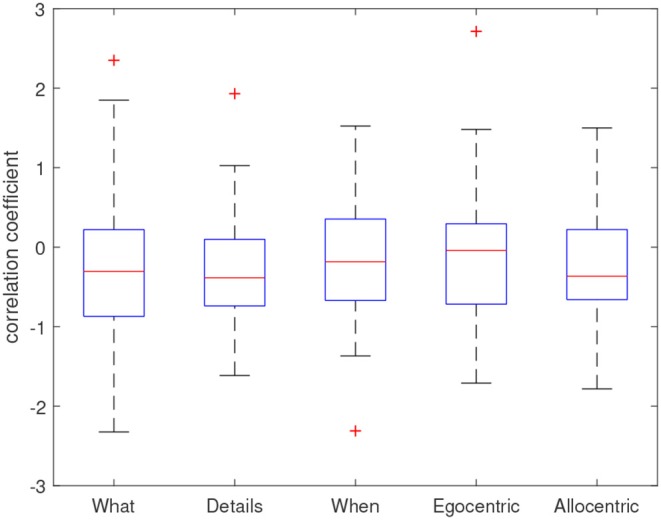
Figure 6.

Distribution of correlation coefficients across patients. Coefficients represent Fisher-r-to-z-transformed correlation coefficients resulting from a patient-wise Pearson correlation between antiepileptic drug load and memory scores over all available test sessions.
