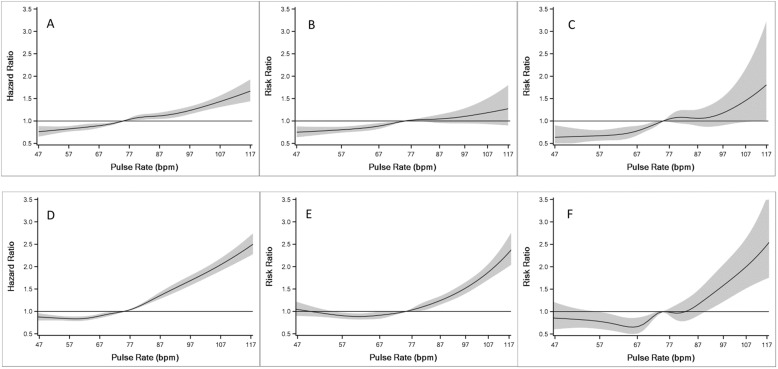
Fig. 2.
Cubic spline plots for multivariable adjusted association of outcomes with baseline and longitudinal pulse rates. (Central Illustration) Association of baseline pulse rate with (a) mortality using a Cox Proportional Hazards model, and (b) number of days all-cause hospitalizations per year, and (c) number of days heart failure hospitalizations per year using Poisson models. Associations of repeated pulse rates with (d) mortality using a Cox Proportional Hazards model, and (e) number of days all-cause hospitalizations per year, and (f) number of days heart failure hospitalizations per year using generalized estimating equation based negative binomial models. Bpm = beats per minute

