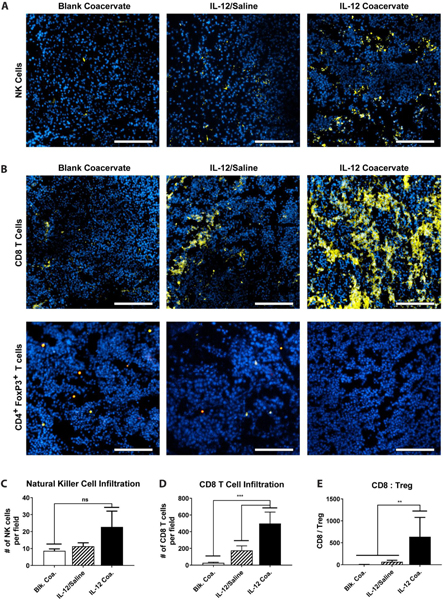
Figure 5. Treatment with IL-12 Coacervates Improves Innate and Adaptive Immune Cell Infiltration in the TME.

A. Mice receiving various treatments were euthanized 5 days post-treatment, with resected tumors assessed for the presence of NKp46+ cells in the tumor (blue: nucleus, yellow: NKp46, scale bar: 200 μm). B. TME presence of CD8α+ cells (top) and CD4+FoxP3+ cells (bottom) were assessed 12 days post-treatment (blue: nucleus, yellow: CD8α, red: CD4, teal: FoxP3, scale bar: 200 μm). The fluorescence signal was quantified from at least five different fields to yield average numbers of C. NKp46+ cells and D. CD8α+ cells (*p<0.05, ***p<0.001, ****p<0.0001) per unit tissue area. E. CD8α+:CD4+FoxP3+ was quantified for the different treatment groups (**p<0.01).
