
Fig. 5.
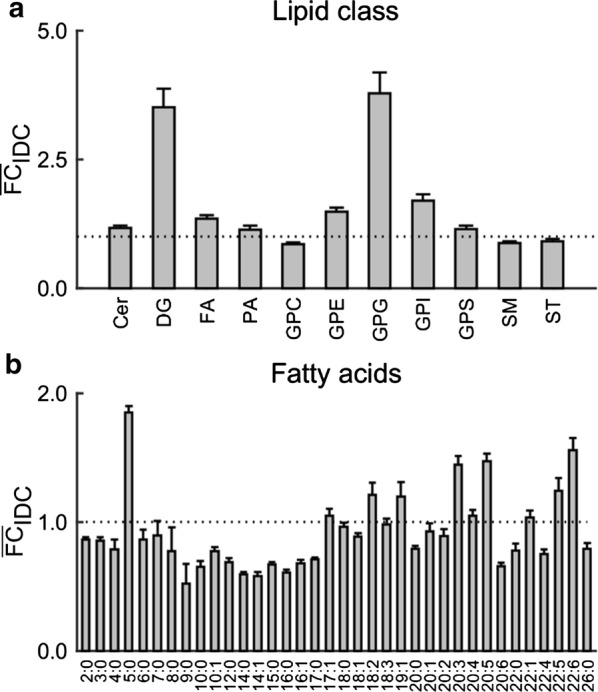
Fold change in abundance of lipid and fatty acid metabolites during the intraerythrocytic developmental cycle (IDC). a Lipid metabolites were classified according to the LIPID MAPS Structure Database [51] into 13 subordinate classes. The figure shows fold changes in lipid classes that contain two or more metabolites. The fold changes were greatest for diacylglycerol (DG) and glycerophosphoglycerol (GPG) metabolites. b Fold change in abundance of fatty acids based on different carbon-chain lengths. The fold change was greatest for the 5-carbon fatty acids (~ 1.8-fold in iRBC cultures relative to uRBC cultures), followed by a number of 18-carbon, 20-carbon, and 22-carbon polyunsaturated fatty acids (~ 1.5-fold). The was computed as the average (described in Fig. 3c) when a metabolite class contained more than one metabolite. Each error bar shows the standard deviation of the of metabolites present in a metabolite class. Cer ceramide, DG diacylglycerol, FA fatty acid amide, PA glycerophosphate, GPC glycerophosphocholine, GPE glycerophosphoethanolamine, GPG glycerophosphoglycerol, GPI glycerophosphoinositol, GPS glycerophosphoserine, SM phosphosphingolipid, ST sterol