Abstract
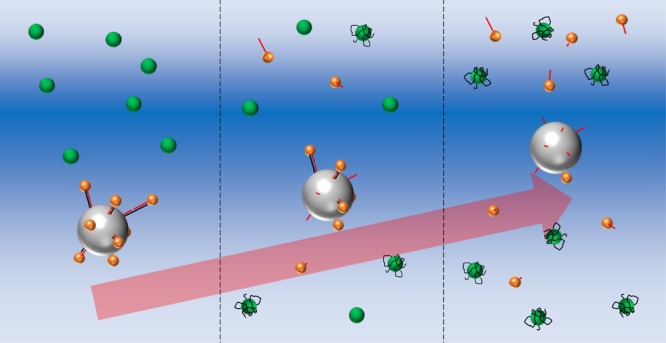
We present aptamer-based sensing using a coupled acoustic-gravitational (CAG) field, which transduces a change in the density of a microparticle (MP) to a change in the levitation coordinate. A large density of the MP is initially induced by the binding of gold nanoparticles (AuNPs) on the MP through sandwich hybridization with aptamer DNA molecules. Targets added to the system interact with the aptamer DNA molecules to form complexes, and the duplex between the aptamer and the probe DNA molecules is dissociated. This leads to the release of AuNPs from the MP and a decrease in its density. As the target concentration increases, the levitation coordinate of the MP increases. From the levitation coordinate shift, we can determine the target concentration. The detection limits for adenosine triphosphate, dopamine, and ampicillin as test targets are 9.8 nM, 17 nM, and 160 pM, respectively. The dissociation constants for the aptamer–target complexes are quantitatively determined from the dependence of the levitation coordinate on the target concentration. This scheme is a useful analytical tool not only for the trace analyses of targets but also for the evaluation of aptamer–target interactions.
Introduction
Aptamers, which are single-stranded DNA or RNA molecules comprising 10–100 nucleotides, can selectively bind targets such as metal ions, small organic molecules, peptides, proteins, and cells with high affinity and specificity. Aptamers are mostly identified by in vitro selections, that is, the systematic evolution of ligands by exponential enrichment (SELEX). Aptamers allow versatile designs of efficient analytical methods, which have many advantages over antibody-based systems, for example, high thermal stability, ease of handling and synthesis, low immunogenicity, low toxicity, and reusability.1−5 For these reasons, aptamers have received much attention in various fields such as clinical diagnosis, forensics, food safety, and environmental science, and various bioanalytical schemes have been proposed based on aptamer chemistry.
Aptamer-based sensing often utilizes the conformation changes of aptamer molecules, which can be classified into simple binding, folding, and structure switching.5 In the simple binding methods, the binding between aptamers and targets is detected in the form of changes in electrochemical signals, fluorescence intensity, mass, and refractive index.6−8 The aptamer folding is modified by the formation of an aptamer–target complex, which changes, for example, the fluorescence intensity.9,10 Stojanovic et al. reported a fluorescence sensor for cocaine using aptamer folding.11 In this method, the ends of the aptamer molecules were labeled with a fluorophore and quencher. Whereas the fluorescence signal was observed in the absence of cocaine because the fluorophore and quencher were located apart, the fluorescence decreased in the presence of cocaine because the aptamer folding owing to the cocaine complex formation forced the fluorophore and quencher to come together. However, this detection scheme is limited to the cases where the head–tail contact of the aptamer is induced by its complexation. In contrast, structure switching, which uses the duplex dissociation between the aptamer and complementary DNA by the interaction of the aptamer with the target, allows more versatile designs of biosensing.6,12,13 Lu et al., for example, proposed a detection scheme for human thrombin using this approach and demonstrated a detection limit at the nanomolar (nM) level.14 Graphene oxide, which acts as a fluorescence quencher, effectively adsorbs single-strand aptamer DNA. The complexation of a target with the aptamer causes the desorption of the aptamer from the graphene oxide surface. This entire process enhances fluorescence. Structure switching also involves the duplex dissociation between the aptamer and complementary DNA molecules in the presence of a target. This approach was applied to various detection schemes also.
The schematic design and sensitivity of aptamer-based sensors largely rely on the stability of the aptamer–target complex. A number of methods have been developed for the determination of the dissociation constants (Kd) of aptamer–target complexes, which include surface plasmon resonance (SPR) and electrophoresis.15−18 Win et al. determined the Kd values for the codeine–aptamer complexes using a direct coupling SPR assay.19 Two most stable aptamers, with Kd = 2.50 and 4.00 μM, were found from the sequences generated using an iterative in vitro selection process. Lee et al. reported an aptamer DNA-based SPR biosensor for the retinol binding protein 4 (RBP4).20 The label-free RBP4 detection was performed using SPR with an aptamer-immobilized gold chip. Gong et al. reported the determination of Kd for a thrombin–aptamer complex using microchip capillary electrophoresis, in which the peak ratio of free and bound aptamers is used to obtain Kd.21
We demonstrated the label-free sensing of DNA and microRNA molecules based on the levitation coordinate shifts of a single microparticle (MP) in a combined acoustic–gravitational (CAG) field.22,23 MPs are levitated in the CAG field at different coordinates according to their acoustic properties (density and compressibility). The density change of the MP, which was induced by the binding of gold nanoparticles (AuNPs) through DNA or RNA sandwich hybridization, caused the levitation coordinate shifts of the MP in the CAG field.22,23 This method allowed the zeptomole (zmol) detection of DNA and microRNA. We also evaluated the kinetics involved in the avidin–biotin reaction in the CAG field.24 Thus, this approach is efficient not only for highly responsive sensing applications but also for the evaluation of the reaction involved in detection schemes. The utilization of aptamers is expected to enhance the usefulness of this method and significantly extend its applicability. In this paper, we propose a highly versatile detection scheme based on the MP levitation in a CAG field using aptamer DNA molecules. Aptamer DNA mediates the binding between an MP and AuNPs through sandwich hybridization. The interaction between the target and aptamer induces the dissociation of the duplex, and AuNPs are released from the MP. Thus, the density of the MP becomes lower, and its levitation coordination thereby shifts according to the target concentration. Further, this method allows the quantitative evaluation of the complexation between the aptamer and target molecules from the levitation behavior of the MP.
Result and Discussion
Sensing Principle
The levitation coordinate of an MP, z, in the CAG field is given by22−28
| 1 |
| 2 |
| 3 |
where λ is the ultrasound wavelength, Eac is the average ultrasound energy density, a is a device-dependent parameter, V is the voltage applied to the transducer, g is the gravitational acceleration, and ρ and γ are the density and compressibility of the medium (water in the present case), respectively. The prime represents the corresponding properties of the MP. Eq 1 suggests that z is a function of the particle density and compressibility. Thus, any change in the acoustic properties of the MP can be evaluated from the shift of z.
Figure 1 shows the relationship between V and z of PMMAs with different densities, that is, 1.188 and 1.265 g cm–3. Because Eac is proportional to V2, as indicated by eq 3, a decrease in V lowers the levitation coordinate of the MP. When the acoustic radiation force becomes smaller than the threshold value (Vth), the MP is no longer levitated. The levitation coordinate difference between the PMMAs with different densities increases with decreasing V and is, therefore, maximized at Vth. The solid curves represent the results of curve-fitting based on eq 1 with a as the fitting parameter. The compressibility was assumed to be the same for both PMMAs (γ′ = 1.54 × 10⁻¹⁰ Pa–1). Curve fitting yielded a = 0.0408 and 0.0388 for low- and high-density PMMAs, respectively. Because the a values determined for different MPs almost agreed with each other, the average value, a = 0.040, is applied to the results as discussed below.
Figure 1.
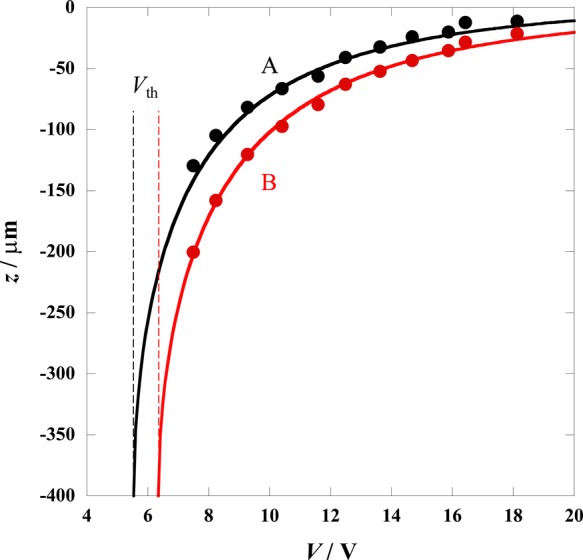
Relationships between the voltage applied to the transducer (V) and the levitation coordinates of PMMAs with different densities: (A) 1.188 and (B) 1.265 g cm–3. Solid curves were calculated using eq 1 with the fitting parameter a = 0.0408 and 0.0388 for A and B, respectively. Vth represents the threshold V values for the PMMAs, below which the particles do not levitate.
As shown in our previous work, the levitation coordinate of an MP is dominantly determined by its density rather than compressibility when the density of the MP is modified by the binding of the AuNPs.24,25 The AuNP possesses two orders of magnitude smaller compressibility than the polymer MP, and therefore, the contribution from the former to the entire compressibility is negligible even though AuNPs cover the entire surface of the MP.25 In this study, AuNP-bound PMMAs were prepared through complementary hybridization between the aptamer DNA and probe DNA anchored on the particles as illustrated in Figure 2. When the AuNP-bound PMMAs are treated with the target molecule, the aptamer DNA interacts with the target and the duplex between the aptamer and probe DNAs is dissociated. The release of AuNPs from the AuNP-bound PMMA lowers its density, and thereby, z increases according to the amount of target added to the system. Magnetic levitation (MagLev) is also an efficient method for measuring the density of a particle.29 MagLev has higher density resolution (10–2–10–6 g cm–3) than the present acoustic levitation. However, magnetic levitation requires a paramagnetic medium, such as Mn2+ or Gd3+, and, therefore, has limited applicability to biological reactions. In addition, MagLev is typically applied to millimeter (mm)-sized materials. Because AuNP-binding induces a larger density change on smaller particles, the use of microparticle is advantageous for sensitive sensing of AuNP binding. From these standpoints, acoustic levitation is suitable for the present purpose.
Figure 2.
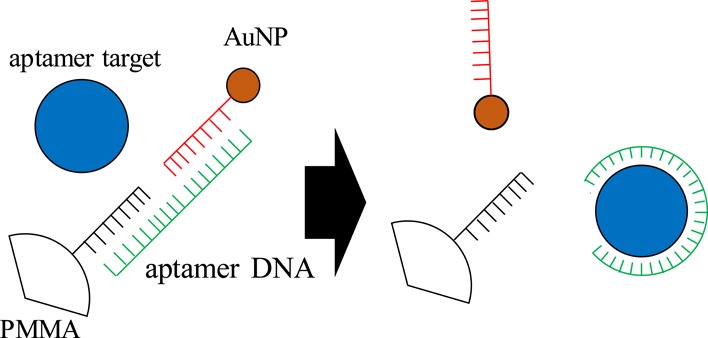
Schematic representation of aptamer-based sensing in the CAG field.
In this study, all of the measurements were conducted at V = 7.5 V, that is, Eac = 2.25 J m–3. Although a lower value of V is advantageous for high sensitivity, this voltage was selected to obtain stable levitation; at lower voltage, the levitation coordinate was changed with time. Figure S1 in the Supporting Information shows the calculated relationship between the number of AuNPs bound on a PMMA (nAuNP/PMMA) and the difference in z between the bare and AuNP-bound PMMAs (Δz) at V = 7.5 V. A linear relationship was confirmed in the range of nAuNP/PMMA = 0–6000. As noted above, a decrease in the density of the AuNP-bound PMMA is induced by the aptamer–target complexation in this study. Therefore, the target concentration can be determined from a decrease in Δz. The linear relationship shown in Figure S1 confirms the reasonability of the principle of the present approach.
Aptamer-Based Sensing of Target Molecules
Adenosine triphosphate (ATP) plays a critical role in the regulation of cellular metabolism.30−33 The shortage of ATP causes various diseases such as angiocardiopathy, hypoglycemia, ischemia, and Parkinson’s disease. Dopamine (DA) is a vital neurotransmitter that plays a significant role in the functioning of our memory, behavior, sleep, and cognition.34−36 The low concentration of DA is related to Parkinson’s disease, attention deficit hyperactivity disorder, and schizophrenia. Therefore, the efficient sensing of these compounds of physiological importance is strongly required in biomedical monitoring. Further, ampicillin (AMP) is widely used to treat infectious bacterial diseases such as pneumonia, gonorrhea, bronchitis, and venereal diseases because of its broad spectrum and low cost.37,38 However, there are several side effects such as skin rashes, dizziness, and diarrhea. Thus, the development of the effective sensing of AMP is also a crucial task.
Aptamer-mediated AuNP-bound PMMAs were treated with various concentrations of the target, that is, ATP, DA, or AMP. The interaction between the aptamer and target induces the dissociation of the binding between the PMMA and AuNP, and Δz decreases as a result. Figure 3 shows the relationships between the logarithmic concentration of ATP, DA, and AMP (log c) and Δz of the PMMA. The levitation of the PMMA was repeatedly measured five times; the error bars in Figure 3 are given based on the standard deviations (σ). The errors in the Δz measurements originate from the deviations of the PMMA size, difference in the ratio of the AuNP-binding between PMMAs, and the instability of the acoustic field. The first factor becomes marginal as the size of the MP increases. In contrast, the sensitivity is higher for smaller MPs because a larger density change is induced by binding of AuNPs. Hence, the size of MP should be optimized taking these two different size dependencies into consideration; the present size (d ∼ 10 μm) was thus determined.24 We confirmed that the acoustic field instability comes not from a temperature change but from a change in the acoustic resonance conditions in the entire instrumental system. It was difficult to keep exactly the same resonance conditions for different measurements; the deviations of Δz mainly arise from this factor. Evidently, Δz decreases with increasing log c in a sigmoidal manner. The limit of detection (LOD) was determined from 3σ for Δz of the probe PMMA in the absence of the target. The details for the determination of LOD are given in Figure S2 and related descriptions in Supporting Information. The LODs for ATP, DA, and AMP were 9.8 nM, 17 nM, and 160 pM, respectively. This means that 3.2 × 10⁸ ATP, 5.5 × 10⁸ DA, and 5.0 × 10⁶ AMP molecules are detectable per single PMMA.
Figure 3.
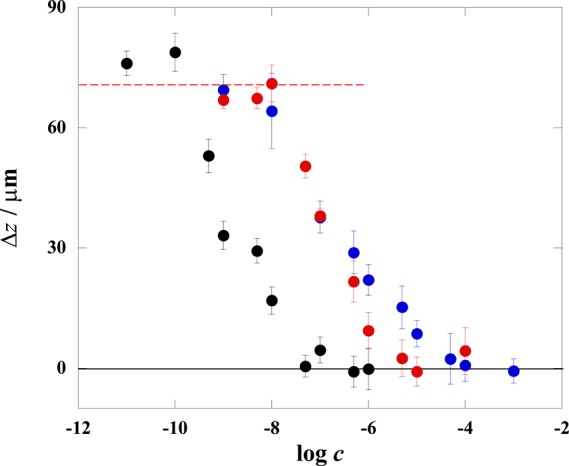
Relationships between the logarithmic concentration target (log c) and Δz for ATP (blue), DA (red), and AMP (black). The red dashed line represents the average maximum Δz at rPMMA/AuNP = 10,000.
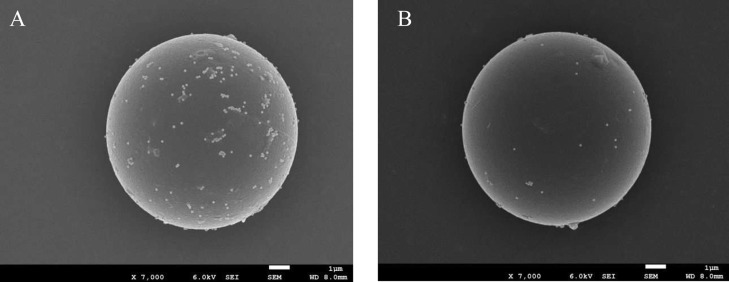
Figure 4 shows FE-SEM images of AuNP-bound PMMAs designed for ATP detection. The particles are compared after reactions with 1 nM and 1 mM ATP. Almost no AuNPs are seen on the PMMA after the reaction with 1 mM ATP, whereas a number of AuNPs remain on the PMMA when treated with 1 nM ATP. Thus, the FE-SEM observation revealed that AuNPs bound on the PMMA were effectively released by the duplex dissociation caused by the reaction of the aptamer with ATP. In this work, the number ratio of AuNPs to PMMA in a sample solution (rAuNP/PMMA) was maintained at 10,000. The surface coverage of AuNPs on the PMMA should be 25% assuming the complete reaction between AuNPs and PMMA. However, as shown in Figure 4, the number of AuNPs on the PMMA was smaller than that expected from the complete binding. This arises from the incomplete binding of AuNPs as well as the loss of AuNPs during the sample preparation for FE-SEM such as filtering, washing, and sputtering. Therefore, the use of FE-SEM for determining of the number of AuNPs bound on a PMMA was not appropriate. We evaluated the actual number of AuNPs bound on a PMMA (nAuNP/PMMA) from Δz. At rAuNP/PMMA = 10,000, the measured Δz was 71 ± 5.2 μm. The linear relationship between Δz and nAuNP/PMMA shown in Figure S1 is represented by the equation Δz = 1.48 × 10⁻²nAuNP/PMMA. From this relation, we confirmed that nAuNP/PMMA = 4736 ± 338 for Δz = 71 ± 5.2 μm. This indicates that the reaction ratio of AuNPs was 47% under the present condition. The surface coverage of AuNPs on the PMMA is thus 12% at rAuNP/PMMA = 10,000. Thus, the present scheme shown in Figure 2 works well, as expected.
Figure 4.
FE-SEM images of PMMAs for ATP at (A) c = 1 nM and (B) c = 1 mM.
Application to a Blood Sample
The present method was applied to the determination of ATP in swine blood. The blood was diluted 104 times with water. The known amounts of ATP were spiked to the diluted blood. AuNP-bound PMMAs mediated by the ATP-aptamer DNA molecules (rAuNP/PMMA = 10,000) were added to the diluted blood and spiked samples, and Δz values were measured for resulting PMMAs in the CAG field. Figure 5 compares the calibration graphs obtained for the diluted blood and for aqueous ATP standard solutions. The Δz values were converted into the ratio of the aptamer molecules that reacted with ATP. This value was plotted against the logarithmic concentration of ATP in this figure. The plots for the standard solutions prepared in water almost overlapped with that prepared in diluted swine blood, suggesting that the blood matrices did not interfere with the present detection scheme.
Figure 5.
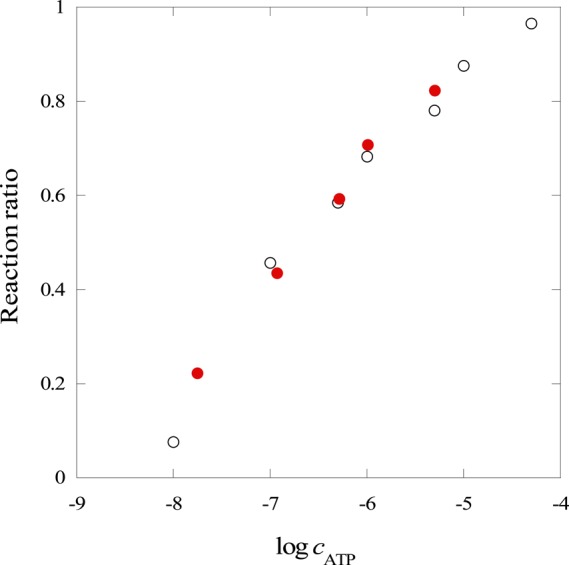
Calibration graphs for ATP in swine blood. Black open circles; standard solutions prepared in water. Red solid circles; standard solution prepared in diluted swine blood.
From the calibration graph, the ATP concentration in the diluted swine blood was determined to be 17.6 nM; the original blood contained 176 μM ATP. The concentration of ATP was also determined by a luciferase assay to validate this concentration; this method also requires 104 times dilution of the blood sample. The luminescence measurement gave 202 μM ATP in the original blood. The agreement between these two values indicates that the present scheme is applicable to real samples without pretreatments.
The incubation time of 4 h in the present method can be a disadvantage for practical purposes. We did not attempt to reduce the incubation time because applications are not the main purpose of the present work. Our previous work24 indicates that the long incubation time originates from the low diffusion nature of the particles and that the reduction of the time results in incomplete reactions (in the present case, the incomplete dissociation of AuNPs from PMMA). However, because the reproducibility rather than incomplete reactions is crucial in practical analyses, the incubation time can be substantially reduced. This is a task for facilitating practical applications.
Equilibrium Model in Aptamer Sensing
As shown in Figure 2, AuNPs, which are bound on the PMMA through hybridization by the aptamer DNA, are released by the interaction between the aptamer and its target molecule. Therefore, the sensitivity of the present scheme is determined by the balance between the sandwich hybridization strength and the stability of the aptamer–target complex. Figure 6 summarizes the equilibria involved in the present scheme. The present results were analyzed using this equilibrium model. The amount of capture DNA anchored on the PMMAs (A) was fluorometrically determined to be 1.6 × 10⁷ molecules per particle using FITC-labeled complementary DNAs. All the capture DNA molecules can be involved in the interparticle hybridization. In contrast, only one reporter DNA molecule on an AuNP takes part in the interparticle hybridization in the presence of the aptamer, and the rest remain free after the completion of the interparticle hybridization. Because of the dominant population of AuNPs over PMMAs in a reaction solution, AuNP-bridged PMMA aggregation was not observed. Therefore, the concentration of C depicted in Figure 6 can be considered to be equal to that of AuNPs. Figure S3 shows the relationship between log K1 and the number of AuNPs bound on a PMMA at rAuNP/PMMA = 10,000. As shown above, because nAuNP/PMMA = 4736 ± 338, K1 was determined to be 1.58 × 10²⁰ M–2.
Figure 6.
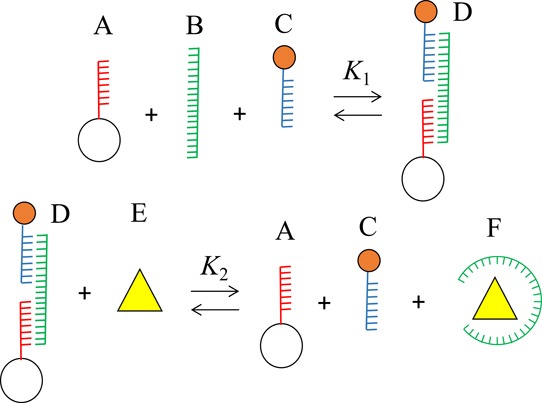
Equilibrium models of aptamer-based sensing. (A)–(F) represent (A) capture probe DNA anchored on PMMA, (B) aptamer, (C) AuNP with probe DNA, (D) duplex between the aptamer and probe DNA molecules, (E) target, and (F) aptamer–target complex.
Figure 7 shows the relationship between log c and the reaction ratios for three aptamer-target combinations. The sigmoidal curves shown in Figure 7 were calculated assuming K2 = 1.00 × 10⁻¹¹ M for AMP and 1.58 × 10⁻¹³ M for DA and K2 = 3.98 × 10⁻¹⁴ M for ATP. Because the dissociation constant of the aptamer and the target, K3, is given by K3 = 1/(K1K2), its values are 6.33 × 10⁻¹⁰, 4.00 × 10⁻⁸, and 1.59 × 10⁻⁷ M–1 for AMP, DA, and ATP, respectively. All of these dissociation constants are larger than the corresponding reported values.39−41 The affinity between the target and the aptamer DNA as well as the strength of the DNA duplex formation is influenced by the buffer salt concentration and/or composition.42−45 For example, Baldrich et al. reported that the structure of thrombin-binding aptamer (TBA) depends on the types of salt added to the system.42 Although the TBA–thrombin complex was stable in the presence of KCl, the addition of Na+ or Mg2+ disrupted the formation of the complex. On the other hand, Munzar et al. reported that the hybridization affinity of the aptamer–complementary DNA duplex increases with the increasing concentration of ions in the buffer.44 Thus, the aptamer–target complexation and formation of an aptamer duplex depend on various factors involving types and concentrations of salts. Therefore, a simple comparison of the dissociation constants for the aptamer–target complexation is difficult. The results discussed here indicate that the present method can be an efficient tool for the evaluation of the aptamer–target complexation.
Figure 7.
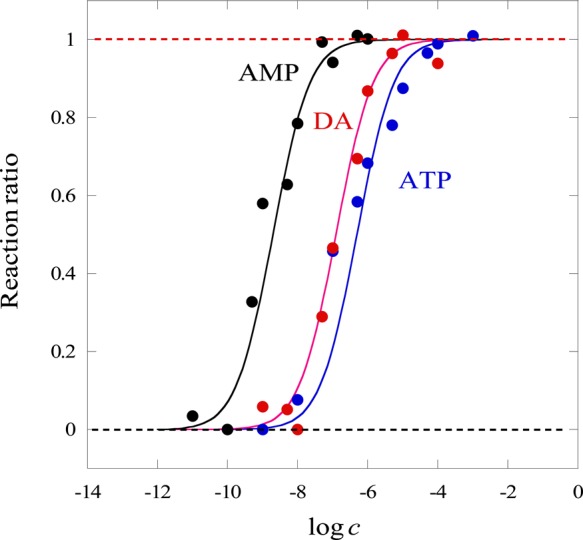
Relationships between the logarithmic target concentration (log c) and the reaction ratios of aptamers-targets calculated from Δz shown in Figure 3. Symbols: ATP: blue dots, DA: red dots, and AMP: black dots. Curves represent the results of calculation assuming K1 = 1.58 × 10²⁰ M–2, K2 = 1.00 × 10⁻¹¹ for AMP, 1.58 × 10⁻¹³ for DA, and 3.98 × 10⁻¹⁴ M for ATP.
Basically, 1:1 aptamer–target binding was assumed for the explanation of the experimental results shown in Figure 6. However, it was reported that the ATP aptamer has two binding sites.45,46 A calculation was also attempted by considering 1:2 (aptamer: ATP) complexation for ATP, as shown in Figure S4. Evidently, the calculated curve departs from the experimental plots and cannot explain the experimental results better than the 1:1 binding assumption. Thus, the 1:1 complexation between the ATP and aptamer is reasonable in the present case.
Conclusions
We proposed aptamer-based sensing for ATP, DA, and AMP as test targets using the CAG field. In this scheme, the duplex of aptamer–complementary DNA is dissociated through aptamer–target complexation, and Δz in the CAG field decreases as a result. The detection limit ranges from picomolar (pM) to nanomolar (nM) depending on the affinity between the aptamer and the target. This scheme also allows us to evaluate the dissociation constants of the aptamer–target complexes without labeling. This is another advantage of the present scheme.
Aptamer DNAs have been developed for inorganic ions (K+, Hg2+, and so on), organic molecules (cocaine, ibuprofen, and so on), large biomolecules (peptides and proteins), and microorganisms (bacteria and cells). The present sensing scheme was designed so that the aptamer crosslinks the two probe DNA molecules anchored on the PMMA and AuNP to yield the AuNP-bound PMMA. This scheme can be extended to any similar system simply by changing the sequence of aptamer and complimentary probe DNA molecules. Further, simultaneous detection of multiple targets is possible using MPs of different sizes, as reported in the case of microRNA detection in our previous work.23 Simultaneous detection is necessary to provide reliable diagnoses under conditions such as inflammation, fungal infection, and toxin accumulation. Thus, the application of the present scheme to a wide range of fundamental and practical fields, including biochemistry, environmental science, and medical diagnoses, is expected.
Experimental Section
The instrument used in this study was basically the same as that employed in our previous work.22−28Figure S5 shows a photo of the instrumental setup. The levitation of an MP was measured in a silica glass cell (of 30 mm length, 8 mm width, and 12.62 mm height) with a rectangular channel (of 3.0 mm width and 1.5 mm height) pasted on a transducer (2 cm × 2 cm lead zirconate titanate, resonance frequency of 500 kHz, Fuji Ceramics). The resonance frequency was 453 kHz under experimental conditions. A diluted MP suspension was introduced into the cell, and a single MP was entrapped by the acoustic radiation force. The levitation coordinate of the particle was measured at a constant voltage of V = 7.5 V supplied to the transducer.
Two types of polymethyl methacrylate MPs (PMMAs) were used to study the effect of their density on the levitation coordinate. PMMA with a density of 1.265 g cm–3 was purchased from GreenChem Inc. (Osaka, Japan). Carboxyl-functionalized PMMA (C-PMMA; 9.57 ± 0.21 μm diameter, 1.188 g cm–3 density) was purchased from Microparticle GmbH (Berlin, Germany). The carboxyl group density of the C-PMMA was 20 μmol g–1. The particle concentration of the C-PMMA in the stock solution was determined to be 1.88 × 10⁸ mL–1 by counting the number of particles contained in 2 μL aliquots of the suspension using a microscope. The carboxyl-functionalized AuNPs with a 100 nm diameter were purchased from Cytodiagnostics (Burlington, Canada). The carboxyl group density of the AuNPs was 255 μmol g–1. The concentration of AuNPs was determined to be 1.92 × 10¹¹ mL–1 by UV–vis spectrometry, which was developed by Fernig et al.47 The probe and aptamer DNA were purchased from Fasmac Co., Ltd. (Kanagawa, Japan). ATP, DA, and AMP were selected as the aptamer-target molecules. The aptamer DNA sequences were determined by referring to the literature.39−41Table 1 summarizes the sequences of nucleotides (probe and aptamer DNA molecules) used in this work. The amino-terminated DNA probes were covalently conjugated onto the C-PMMAs and carboxyl-functionalized AuNPs by the condensation reaction using 1-[3-(dimethylamino)propyl]-3-ethyl carbodiimide and N-hydroxysuccinimide. Swine blood containing sodium citrate as the anticoagulant was purchased from KAC Co. (Kyoto, Japan). The blood was diluted 104 times with water and then used for the determination of the ATP concentration.
Table 1. Sequences of Nucleotides Used in this Work.
| symbol | sequence (5′ → 3′) | functional group |
|---|---|---|
| ATP aptamer | CCTGGGGGAGTATTGCGGAGGAAGG | |
| ATP aptamer capture | ATACTCCCCCAGG-PMMA | amino (3′) |
| ATP aptamer reporter | AuNP-CCTTCCTCCGCA | amino (5′) |
| AMP aptamer | AAAGCGGGCGGTTGTATAGCGGAA | |
| AMP aptamer capture | ACCGCCCGCTTT-PMMA | amino (3′) |
| AMP aptamer reporter | AuNP-TTCCGCTATACA | amino (5′) |
| DA aptamer | GTCTCTGTGTGCGCCAGAGAACACTGGGGCAGATATGGGCCAGCACAGAATGAGGCCC | |
| DA aptamer capture | GGCGCACACAGAGAC-PMMA | amino (3′) |
| DA aptamer reporter | AuNP-GGGCCTCATTCTGTG | amino (5′) |
Aptamer DNA was added to a 10 μL aliquot of a capture DNA-anchored PMMA suspension. The mixture was diluted to 300 μL with tris–HCl buffer (pH 7.4, containing 140 mM NaCl and 5 mM MgCl2) and shaken for 4 h. The reporter DNA-anchored AuNPs (170 μL) were then added to the mixture. The mixture was diluted to 1 mL with tris–HCl buffer and left to stand for 4 h. The mixture was sonicated every 15 min. The number ratio of PMMAs to AuNPs (rAuNP/PMMA) was maintained constant at 10,000 for all of the experiments. The AuNP-bound PMMA suspension was added to the aptamer–target solution. Thereafter, the mixture was diluted to 1.5 mL with tris–HCl buffer and left to stand for 4 h. The mixture was sonicated every 15 min. The number ratio of the aptamer DNA to the AuNP-bound PMMA was maintained constant at 11,000 for all the experiments. Thus, the number ratio of PMMA/AuNP/aptamer was 1:10,000:11,000.
For comparison purpose, the concentration of ATP in the blood sample was determined by a luciferase assay using an ATP determination kit (BA100) purchased from Toyo B-Net (Tokyo, Japan). Luminescence was measured using a luminometer, Luminescencer Octa (ATTO, Tokyo).
JSM-7500F (JEOL, Japan) was used to observe the field-emission scanning electron microscopy (FE-SEM) images of PMMAs. The FE-SEM was operated at 6 kV. High-resolution images were obtained using secondary electron detection. The samples were coated with Pt/Pd.
Acknowledgments
This work was supported by a Grant-in-Aid for the Scientific Research from the Japan Society for the Promotion of Science. We are grateful to Professor Masaru Kato (Showa University) for permission to use a luminometer for the ATP determination. We also thank the Ookayama Materials Analysis Division, Technical Department, Tokyo Institute of Technology, for FE-SEM observations.
Supporting Information Available
The Supporting Information is available free of charge at https://pubs.acs.org/doi/10.1021/acsomega.9b03860.
Relationship between nAuNP/PMMA and Δz, LOD determination, relationship between log K1 and the number of AuNPs bound on a PMMA at rAuNP/PMMA = 10,000, relationships between the log c for ATP and the reaction ratio assuming 1:2 aptamer–ATP complexation, and experimental setup (PDF)
The authors declare no competing financial interest.
Supplementary Material
References
- Ilgu M.; Nilsen-Hamilton M. Aptamers in analytics. Analyst 2016, 141, 1551–1568. 10.1039/C5AN01824B. [DOI] [PMC free article] [PubMed] [Google Scholar]
- Hayat A.; Marty J. L. Aptamer based electrochemical sensors for emerging environmental pollutants. Front. Chem. 2014, 2, 41. 10.3389/fchem.2014.00041. [DOI] [PMC free article] [PubMed] [Google Scholar]
- Ku T.-H.; Zhang T.; Luo H.; Yen T.; Chen P.-W.; Han Y.; Lo Y. H. Nucleic acid aptamers: an emerging tool for biotechnology and biomedical sensing. Sensors 2015, 15, 16281–16313. 10.3390/s150716281. [DOI] [PMC free article] [PubMed] [Google Scholar]
- Du Y.; Dong S. Nucleic acid biosensors: recent advances and perspectives. Anal. Chem. 2017, 89, 189–215. 10.1021/acs.analchem.6b04190. [DOI] [PubMed] [Google Scholar]
- Zhou W.; Huang P.-J. J.; Ding J.; Liu J. Aptamer-based biosensors for biomedical diagnostics. Analyst 2014, 139, 2627–2640. 10.1039/c4an00132j. [DOI] [PubMed] [Google Scholar]
- Cheng A. K. H.; Sen D.; Yu H. Z. Design and testing of aptamer-based electrochemical biosensors for proteins and small molecules. Bioelectrochemistry 2009, 77, 1–12. 10.1016/j.bioelechem.2009.04.007. [DOI] [PubMed] [Google Scholar]
- Li Y.; Lee H. J.; Corn R. M. Detection of protein biomarkers using RNA aptamer microarrays and enzymatically amplified surface plasmon resonance imaging. Anal. Chem. 2007, 79, 1082–1088. 10.1021/ac061849m. [DOI] [PMC free article] [PubMed] [Google Scholar]
- Savran C. A.; Knudsen S. M.; Ellington A. D.; Manalis S. R. Micromechanical detection of proteins using aptamer-based receptor molecules. Anal. Chem. 2004, 76, 3194–3198. 10.1021/ac049859f. [DOI] [PubMed] [Google Scholar]
- Ueyama H.; Takagi M.; Takenaka S. A novel potassium sensing in aqueous media with a synthetic oligonucleotide derivative. Fluorescence resonance energy transfer associated with guanine quartet-potassium ion complex formation. J. Am. Chem. Soc. 2002, 124, 14286–14287. 10.1021/ja026892f. [DOI] [PubMed] [Google Scholar]
- Yang C. J.; Jockusch S.; Vicens M.; Turro N. J.; Tan W. Light-switching excimer probes for rapid protein monitoring in complex biological fluids. Proc. Natl. Acad. Sci. U. S. A. 2005, 102, 17278. 10.1073/pnas.0508821102. [DOI] [PMC free article] [PubMed] [Google Scholar]
- Stojanovic M. N.; de Prada P.; Landry D. W. Aptamer-based folding fluorescent sensor for cocaine. J. Am. Chem. Soc. 2001, 123, 4928–4931. 10.1021/ja0038171. [DOI] [PubMed] [Google Scholar]
- Liu J.; Lee J. H.; Lu Y. Quantum dot encoding of aptamer-linked nanostructures for one-pot simultaneous detection of multiple analytes. Anal. Chem. 2007, 79, 4120–4125. 10.1021/ac070055k. [DOI] [PubMed] [Google Scholar]
- Liu J.; Lu Y. Fast colorimetric sensing of adenosine and cocaine based on a general sensor design involving aptamers and nanoparticles. Angew. Chem., Int. Ed. 2006, 45, 90. 10.1002/anie.200502589. [DOI] [PubMed] [Google Scholar]
- Lu C. H.; Yang H. H.; Zhu C. L.; Chen X.; Chen G. N. A graphene platform for sensing biomolecules. Angew. Chem., Int. Ed. 2009, 48, 4785–4787. 10.1002/anie.200901479. [DOI] [PubMed] [Google Scholar]
- Peyrin E. Nucleic acid aptamer molecular recognition principles and application in liquid chromatography and capillary electrophoresis. J. Sep. Sci. 2009, 32, 1531–1536. 10.1002/jssc.200900061. [DOI] [PubMed] [Google Scholar]
- Yu F.; Zhao Q.; Zhang D.; Yuan Z.; Wang H. Affinity interactions by capillary electrophoresis: binding, separation, and detection. Anal. Chem. 2019, 91, 372–387. 10.1021/acs.analchem.8b04741. [DOI] [PubMed] [Google Scholar]
- Šmuc T.; Ahn I.-Y.; Ulrich H. Nucleic acid aptamers as high affinity ligands in biotechnology and biosensorics. J. Pharm. Biomed. Anal. 2013, 81-82, 210–217. 10.1016/j.jpba.2013.03.014. [DOI] [PubMed] [Google Scholar]
- Cai S.; Yan J.; Xiong H.; Liu Y.; Peng D.; Liu Z. Investigations on the interface of nucleic acid aptamers and binding targets. Analyst 2018, 143, 5317–5338. 10.1039/C8AN01467A. [DOI] [PubMed] [Google Scholar]
- Win M. N.; Klein J. S.; Smolke C. D. Codeine-binding RNA aptamers and rapid determination of their binding constants using a direct coupling surface plasmon resonance assay. Nucleic Acids Res. 2006, 34, 5670–5682. 10.1093/nar/gkl718. [DOI] [PMC free article] [PubMed] [Google Scholar]
- Lee S. J.; Youn B. S.; Park J. W.; Niazi J. H.; Kim Y. S.; Gu M. B. ssDNA aptamer-based surface plasmon resonance biosensor for the detection of retinol binding protein 4 for the early diagnosis of type 2 diabates. Anal. Chem. 2008, 80, 2867–2873. 10.1021/ac800050a. [DOI] [PubMed] [Google Scholar]
- Gong M.; Nikcevic I.; Wehmeyer K. R.; Limbach P. A.; Heineman W. R. Protein-aptamer binding studies using microchip affinity capillary electrophoresis. Electrophoresis 2008, 29, 1415–1422. 10.1002/elps.200700777. [DOI] [PMC free article] [PubMed] [Google Scholar]
- Miyagawa A.; Harada M.; Okada T. Zeptomole biosensing of DNA with flexible selectivity based on acoustic levitation of a single microsphere binding gold nanoparticles by hybridization. ACS Sensors 2018, 3, 1870–1875. 10.1021/acssensors.8b00748. [DOI] [PubMed] [Google Scholar]
- Miyagawa A.; Harada M.; Okada T. Multiple microRNA quantification based on acoustic levitation of single microspheres after one-pot sandwich interparticle hybridization. Anal. Chem. 2018, 90, 13729–13735. 10.1021/acs.analchem.8b04143. [DOI] [PubMed] [Google Scholar]
- Miyagawa A.; Harada M.; Okada T. Zeptomole detection scheme based on levitation coordinate measurements of a single microparticle in a coupled acoustic-gravitational field. Anal. Chem. 2018, 90, 2310–2316. 10.1021/acs.analchem.7b04752. [DOI] [PubMed] [Google Scholar]
- Miyagawa A.; Inoue Y.; Harada M.; Okada T. Acoustic sensing based on density shift of microspheres by surface binding of gold nanoparticles. Anal. Sci. 2017, 33, 939–944. 10.2116/analsci.33.939. [DOI] [PubMed] [Google Scholar]
- Kanazaki T.; Hirawa S.; Harada M.; Okada T. Coupled acoustic-gravity field for dynamic evaluation of ion exchange with a single resin bead. Anal. Chem. 2010, 82, 4472–4478. 10.1021/ac100275p. [DOI] [PubMed] [Google Scholar]
- Kanazaki T.; Okada T. Two-dimensional particle separation in coupled acoustic-gravity-flow field vertically by composition and laterally by size. Anal. Chem. 2012, 84, 10750–10755. 10.1021/ac302637e. [DOI] [PubMed] [Google Scholar]
- Masudo T.; Okada T. Particle characterization and separation by a coupled acoustic-gravity field. Anal. Chem. 2001, 73, 3467–3471. 10.1021/ac001354b. [DOI] [PubMed] [Google Scholar]
- Ge S.; Nemiroski A.; Mirica K. A.; Mace C. R.; Hennek J. W.; Kumar A. A.; Whitesides G. M. Magnetic levitation in chemistry, materials science, and biochemistry. Angew. Chem., Int. Ed. 2019, 10.1002/anie.201903391. [DOI] [PubMed] [Google Scholar]
- Ma C.; Lin C.; Wang Y.; Chen X. DNA-based ATP sensing. TrAC, Trends Anal. Chem. 2016, 77, 226–241. 10.1016/j.trac.2016.01.013. [DOI] [Google Scholar]
- Rajendran M.; Dane E.; Conley J.; Tantama M. Imaging adenosine triphosphate (ATP). Biol. Bull. 2016, 231, 73–84. 10.1086/689592. [DOI] [PMC free article] [PubMed] [Google Scholar]
- Dong J.; Zhao M. In-vivo fluorescence imaging of adenosine 5′-triphosphate. TrAC, Trends Anal. Chem. 2016, 80, 190–203. 10.1016/j.trac.2016.03.020. [DOI] [Google Scholar]
- Ng S.; Lim H. S.; Ma Q.; Gao Z. Optical aptasensors for adenosine triphosphate. Theranostics 2016, 6, 1683–1702. 10.7150/thno.15850. [DOI] [PMC free article] [PubMed] [Google Scholar]
- Sajid M.; Nazal M. K.; Mansha M.; Alsharaa A.; Jillani S. M. S.; Basheer C. Chemically modified electrodes for electrochemical detection of dopamine in the presence of uric acid and ascorbic acid: A review. TrAC, Trends Anal. Chem. 2016, 76, 15–29. 10.1016/j.trac.2015.09.006. [DOI] [Google Scholar]
- Pandikumar A.; How G. T. S.; See T. P.; Omar F. S.; Jayabal S.; Kamali K. Z.; Yusoff N.; Jamil A.; Ramaraj R.; John S. A.; Lim H. N.; Huang N. M. Graphene and its nanocomposite material based electrochemical sensor platform for dopamine. RSC Adv. 2014, 4, 63296–63323. 10.1039/C4RA13777A. [DOI] [Google Scholar]
- Rasheed P. A.; Lee J. S. recent advances in optical detection of dopamine using nanomaterials. Microchim. Acta 2017, 184, 1239–1266. 10.1007/s00604-017-2183-6. [DOI] [Google Scholar]
- Mehlhorn A.; Rahimi P.; Joseph Y. Aptamer-based biosensors for antibiotic detection: A review. Biosensors 2018, 8, 54. 10.3390/bios8020054. [DOI] [PMC free article] [PubMed] [Google Scholar]
- Shrivas K.; Sahu J.; Maji P.; Sinha D. Label-free selective detection of ampicillin drug in human urine samples using silver nanoparticles as a colorimetric sensing probe. New J. Chem. 2017, 41, 6685–6692. 10.1039/C7NJ00448F. [DOI] [Google Scholar]
- Huizenga D. E.; Szostak J. W. A DNA aptamer that binds adenosine and ATP. Biochemistry 1995, 34, 656–665. 10.1021/bi00002a033. [DOI] [PubMed] [Google Scholar]
- Song K. M.; Jeong E.; Jeon W.; Cho M.; Ban C. Aptasensor for ampicillin using gold nanoparticle based dual fluorescence-colorimetric methods. Anal. Bioanal. Chem. 2012, 402, 2153–2161. 10.1007/s00216-011-5662-3. [DOI] [PubMed] [Google Scholar]
- Walsh R.; DeRosa M. C. retention of function in the DNA homolog of the RNA dopamine aptamer. Biochem. Biophys. Res. Commun. 2009, 388, 732–735. 10.1016/j.bbrc.2009.08.084. [DOI] [PubMed] [Google Scholar]
- Baldrich E.; Restrepo A.; OˈSullivan C. K. aptasensor development: Elucidation of critical parameters for optical aptamer performance. Anal. Chem. 2004, 76, 7053–7063. 10.1021/ac049258o. [DOI] [PubMed] [Google Scholar]
- Haq I.; Lincoln P.; Suh D.; Norden B.; Chowdhry B. Z.; Chaires J. B. Interaction of Δ- and Λ-[Ru(phen)2DPPZ]2+ with DNA: A colorimetric and Equilibrium binding study. J. B. J. Am. Chem. Soc. 1995, 117, 4788–4796. 10.1021/ja00122a008. [DOI] [Google Scholar]
- Munzar J. D.; Ng A.; Juncker D. Duplexed aptamers: history, design, theory, and application to biosensing. Chem. Soc. Rev. 2019, 48, 1390–1419. 10.1039/C8CS00880A. [DOI] [PubMed] [Google Scholar]
- Wang J.; Jiang Y.; Zhou C.; Fang X. Aptamer-based ATP assay using a luminescent light switching complex. Anal. Chem. 2005, 77, 3542–3546. 10.1021/ac050165w. [DOI] [PubMed] [Google Scholar]
- Jhaveri S. D.; Kirby R.; Conrad R.; Maglott E. J.; Bowser M.; Kennedy R. T.; Glick G.; Ellington A. D. Designed signaling aptamers that transduce molecular recognition to changes in fluorescence intensity. J. Am. Chem. Soc. 2000, 122, 2469–2473. 10.1021/ja992393b. [DOI] [Google Scholar]
- Haiss W.; Thanh N. T. K.; Aveyard J.; Fernig D. G. Determination of size and concentration of gold nanoparticles from UV-vis spectra. Anal. Chem. 2007, 79, 4215–4221. 10.1021/ac0702084. [DOI] [PubMed] [Google Scholar]
Associated Data
This section collects any data citations, data availability statements, or supplementary materials included in this article.


