Figure 3.

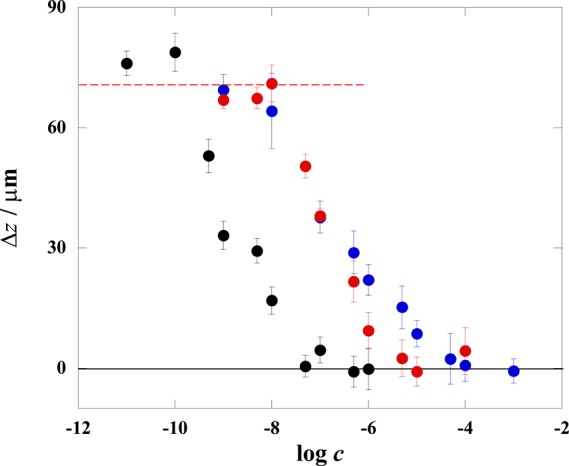
Relationships between the logarithmic concentration target (log c) and Δz for ATP (blue), DA (red), and AMP (black). The red dashed line represents the average maximum Δz at rPMMA/AuNP = 10,000.

Relationships between the logarithmic concentration target (log c) and Δz for ATP (blue), DA (red), and AMP (black). The red dashed line represents the average maximum Δz at rPMMA/AuNP = 10,000.