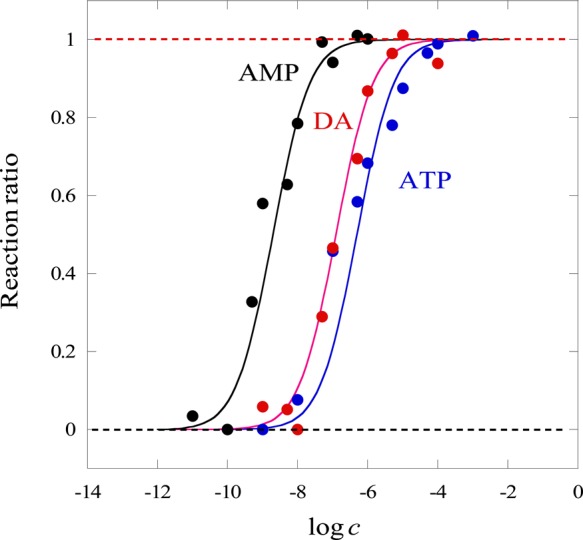
Figure 7.

Relationships between the logarithmic target concentration (log c) and the reaction ratios of aptamers-targets calculated from Δz shown in Figure 3. Symbols: ATP: blue dots, DA: red dots, and AMP: black dots. Curves represent the results of calculation assuming K1 = 1.58 × 10²⁰ M–2, K2 = 1.00 × 10⁻¹¹ for AMP, 1.58 × 10⁻¹³ for DA, and 3.98 × 10⁻¹⁴ M for ATP.
