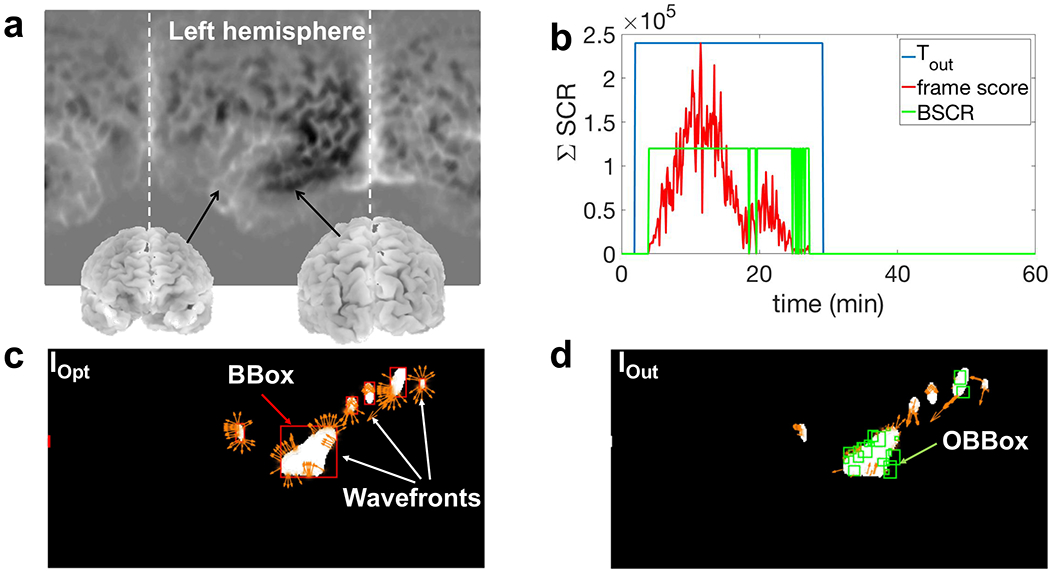
Fig. 14:

a) Locations of different parts of brain for the binary images IOpt and IOut in this example. In this figure, the left hemisphere is located in the middle where the CSD starts to propagate; b) temporal output of the detection algorithm (Tout) for the simulated CSD using the mesoscale model (2 cm wide); c) IOpt which shows optical vectors of CSD “wavefronts” in addition to the BBoxes of connected components (red boxes); d) IOut in which the detected CSD wavefronts are marked using multiple green bounding boxes (OBBox). Based on the consistency in the direction and speed of the wavefronts, these OBBoxes are scored and selected.
