Fig. 7.
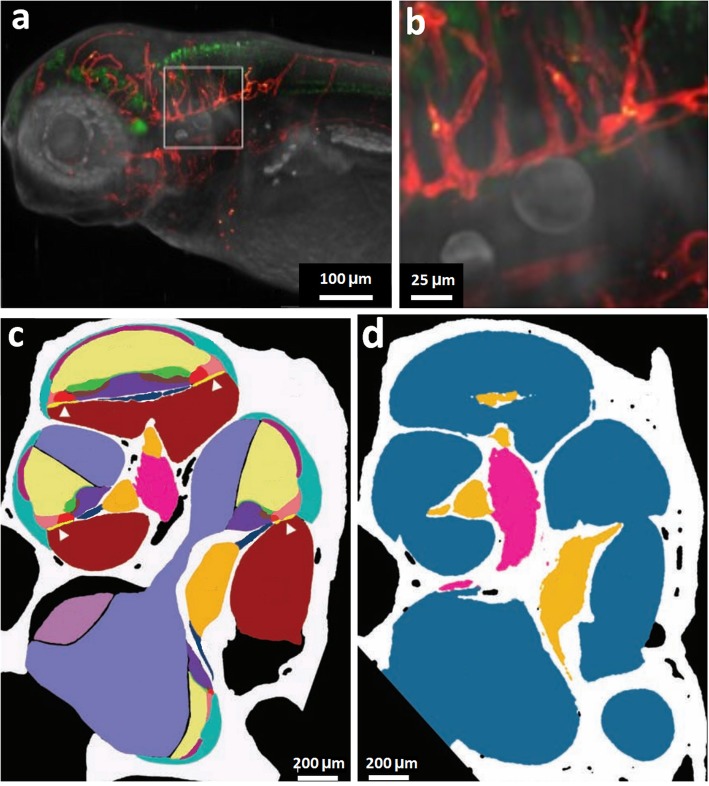
LSFM with complementary μCT and visible light tomography. a, b Zebrafish (lateral view) imaged using correlative LSF and visible light tomography, showing a head of the zebrafish and b larger view to show detail. Red = vasculature, green = nervous system [89]. c, d Cross-section through the segmented reconstruction of the midmodiolar section of the mouse right ear, imaged using c LSFM and d μCT. From the LSFM data, 15 tissue types can be identified: bone (white), spiral ligament (turquoise), saccule (pale purple), stria vascularis (dark purple), tectorial membrane (green), scala media (cream), basilar membrane (yellow with white arrowhead), Rosenthal’s canal (orange), Claudius cells (pale pink), modiolus (bright pink), organ of Corti (bright red), scala tympani (dark red), scala vestibuli (pale blue), spiral limbus (mid-blue), osseous spiral lamina (dark blue). From the μCT data, four tissue types can be identified: bone (white), cochlea scalae and vestibular labyrinth (blue), Rosenthal’s canal (orange) and modiolus (pink) [90] Images in a and b reproduced with permission from [89], Development: Bassi A, Schmid B, Huisken J, Development, 2015, 142(5):1016–20. Images in c and d reproduced with permission from [90]

