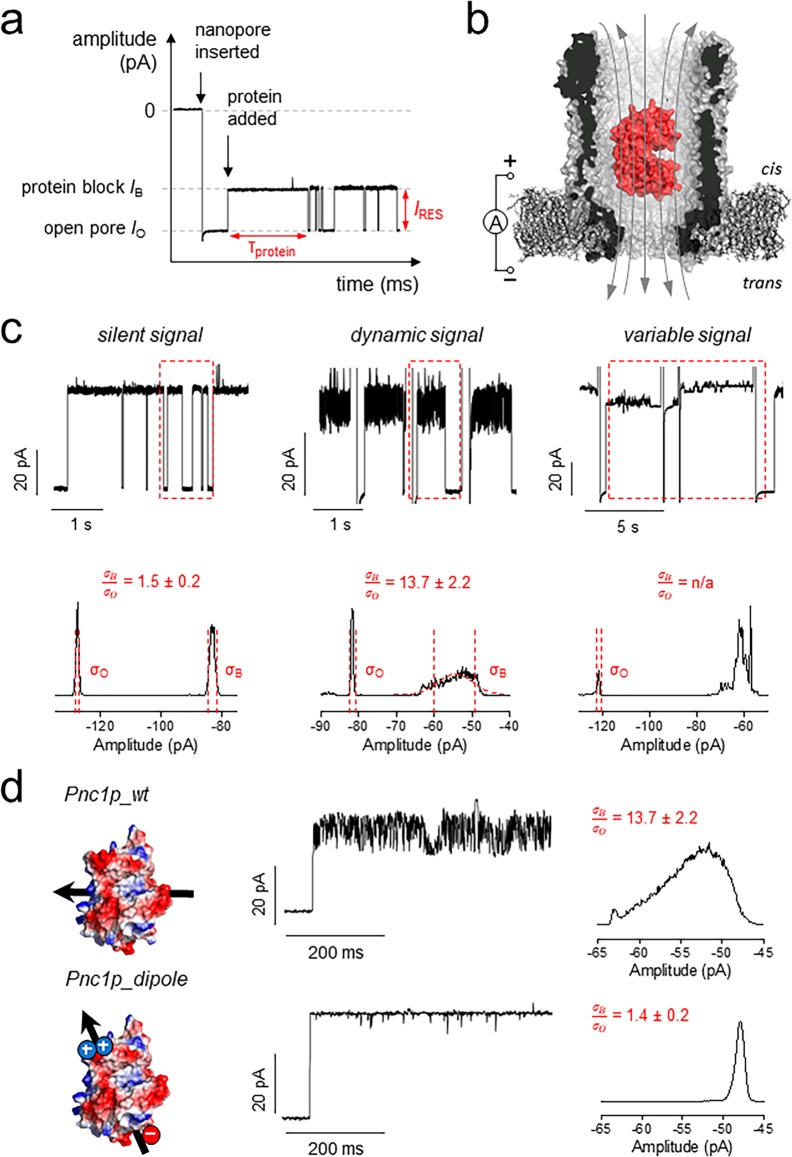
Figure 2.
Protein signals in the ClyA-AS nanopore. (a) Typical trace showing the main measurands of an adaptor protein in the pore: dwell time (τprotein) and residual current (IRES = IB/IO × 100%). In a typical experiment, thousands of dwell times are collected and exponential fits are used to determine the average τprotein. IB and IO were determined by Gaussian fitting to all-point histograms of protein blockades. (b) Representation of a protein (BtuF) electrophoretically captured in the pore. The gray arrows indicate the flux of ions across the nanopore. (c) Example of the three different signals and corresponding full-point histograms of a 1 s trace. σB/σO represents the ratio of the standard deviation of the Gaussian fitting of the open pore current and the protein block current as measured from full-point histograms. (d) Protein signal optimization. On the left: Surface representation of Pnc1p and Pnc1p_dipole (D82K, D83K, K216E, Δ6xHis) with the arrow showing the direction of the protein dipole. The current trace shows a typical protein blockade. The histograms were calculated from a representative 10 s of protein block. All measurements were performed in 15 mM Tris and 150 mM NaCl, pH 7.5, under negative bias (trans) and sampling at 10 kHz with a 2 kHz Bessel filter. For figure preparation, all traces were additionally filtered with a 500 Hz Gaussian filter.

