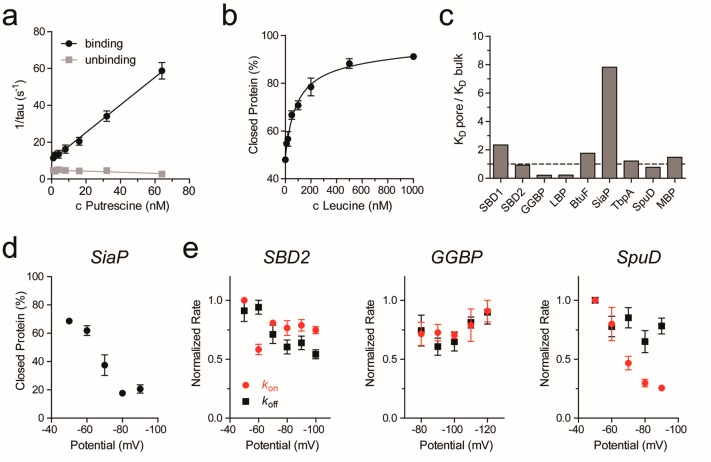
Figure 4.
Dissociation constants and binding rates. (a) Representative example of rate constant determination. Binding and unbinding frequencies were determined from event dwell times (see also Figure S2bc). (b) Representative example of a ligand binding curve. The percentage of protein in the closed state was determined by the analysis of full-point histograms followed by ratio calculation of the peak height of the bound and unbound protein state over concentration (see also Figure S5bc). (c) Difference between the KD determined in the nanopore (KD pore) and the KD reported in the literature (KD bulk); see also Table 1. (d) Change in the percentage of SiaP in the closed state with increasing negative potential at a fixed sialic acid concentration of 150 nM. (e) Binding and unbinding rates for three different proteins with increasing negative potential at a fixed ligand concentration (SBD2: 830 nM glutamine; GGBP: 50 nM glucose; SpuD: 8 nM putrescine). Kon and koff were determined and then normalized to the highest value of every measurement. All experiments were performed in triplicates. The error bars represent the standard error of the mean.

