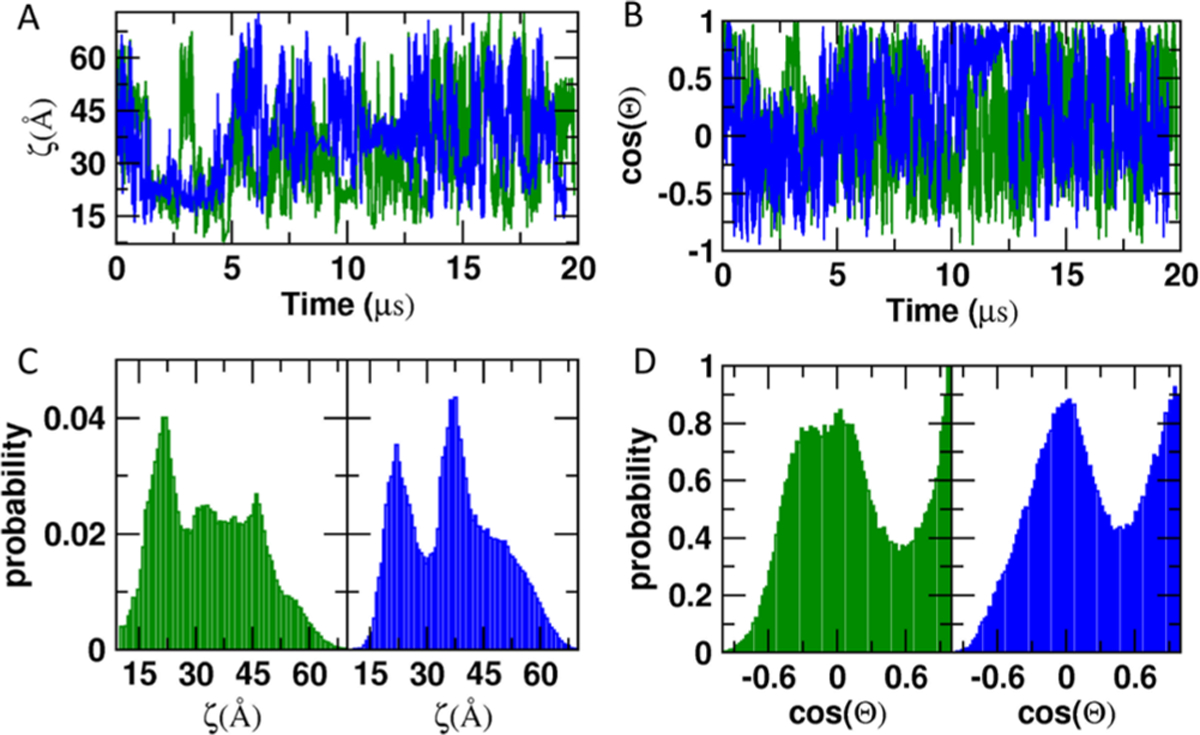
Figure 2.

Conformational fluctuations of membrane-bound G12D and Q61H KRAS. (A, B) Evolution of ζ (A) and cos(Θ) (B) during a 20 μs MD simulation. (C, D) Normalized histograms of ζ (C) and cos(Θ) (D). G12D is in green and Q61H in blue. ζ = distance between the Cα atoms of residues D132 and T183; cos(Θ) = cosine of the angle between a vector along β-strand 1 (residues 5–9) and the membrane normal.
