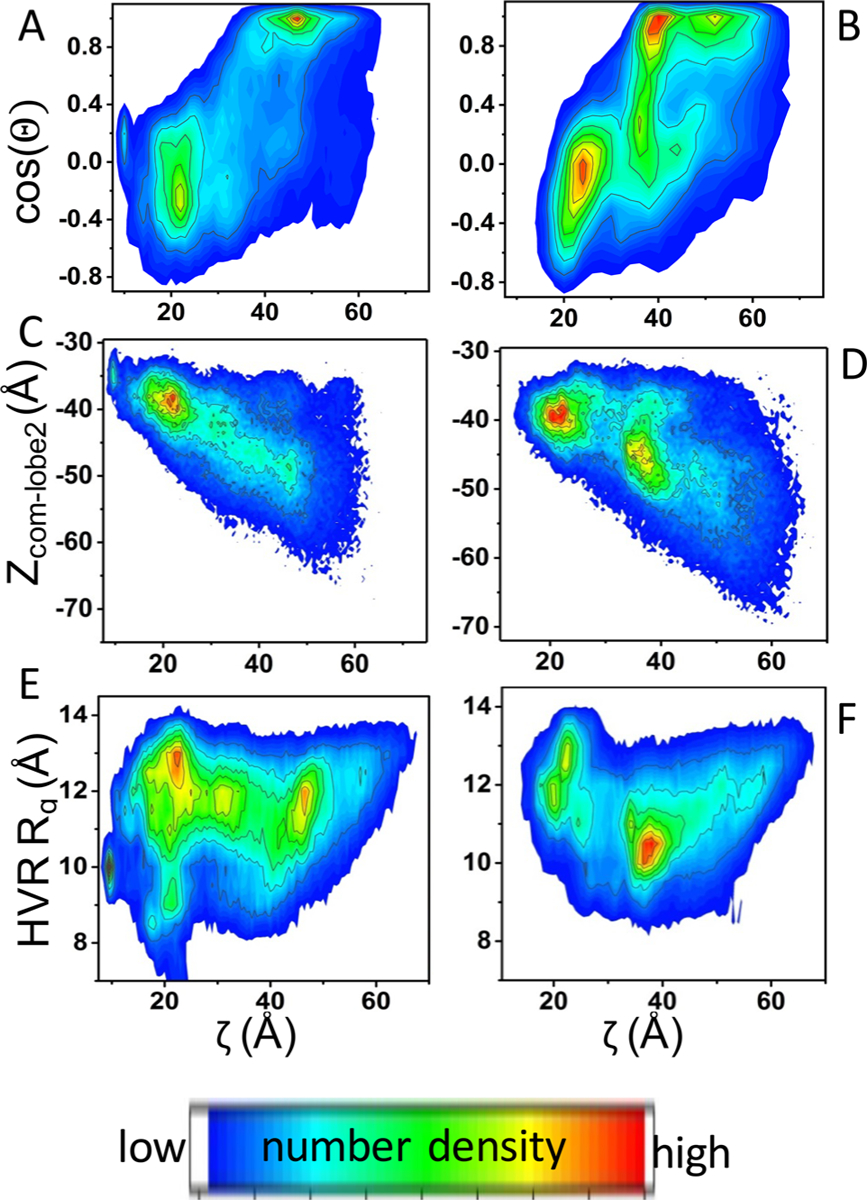
Figure 3.

Distribution of orientation states examined by different reaction coordinates. 2D probability density distributions of the MD-derived data for G12D (left panels) and Q61H KRAS (right panels). (A, B) P(ζ,cos(Θ)); (C, D) P(ζ,Zcom_lobe2); (E, F): P(ζ,HVR Rg). Zcom_lobe2 = center-of-mass distance between lobe2 and the bilayer; HVR Rg = radius of gyration of the HVR (residues 167–185). See text and Figure 2 for the definition of the other reaction coordinates.
