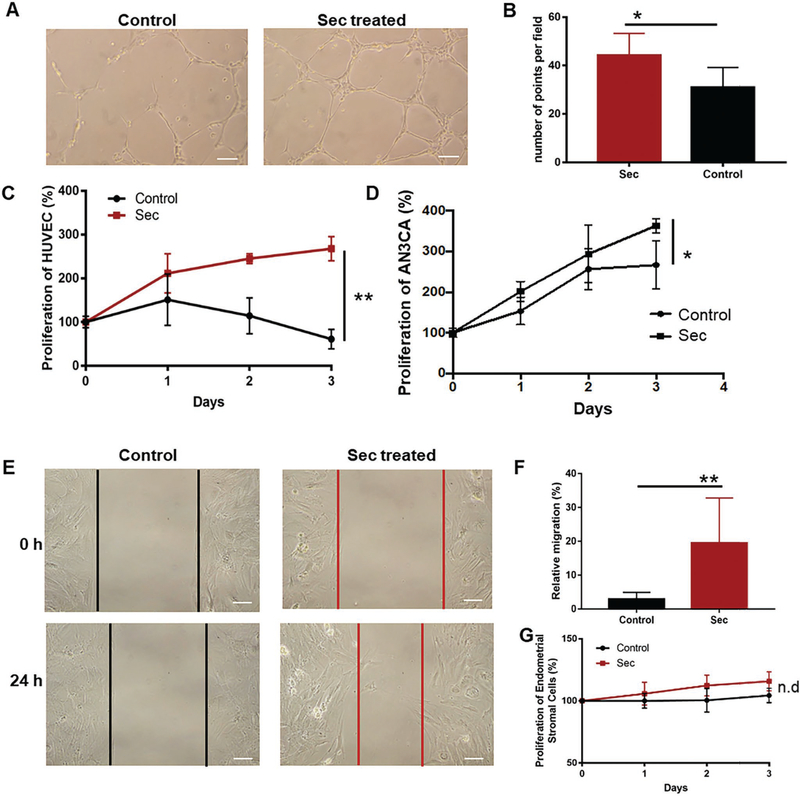
Figure 4.
In vitro cell-based assays. A) HUVEC tubing images of MSC-Sec-treated group and control group. Scale bar: 20 μm. B) Graph comparing the number of tube points between MSC-Sec-treated group and control group, n = 3. C) Proliferation of HUVEC with IMDM (control group) or MSC-Sec group. D) Proliferation of AN3CA treated with IMDM or MSC-Sec. * indicates P < 0.05 when compared to the control group. E) The image of cell migration of rat endometrial epithelial cells (EEC) cultured with IMDM (control group) or MSC-Sec. Scale bar: 20 μm. F) Analysis of the migration rate of EEC of the control group and MSC-Sec group. G) Proliferation of rat endometrial stromal cells cultured with IMDM or MSC-Sec. n = 6 for each group if no further description, * indicates P < 0.05, ** indicates P < 0.01.

