Figure 3.

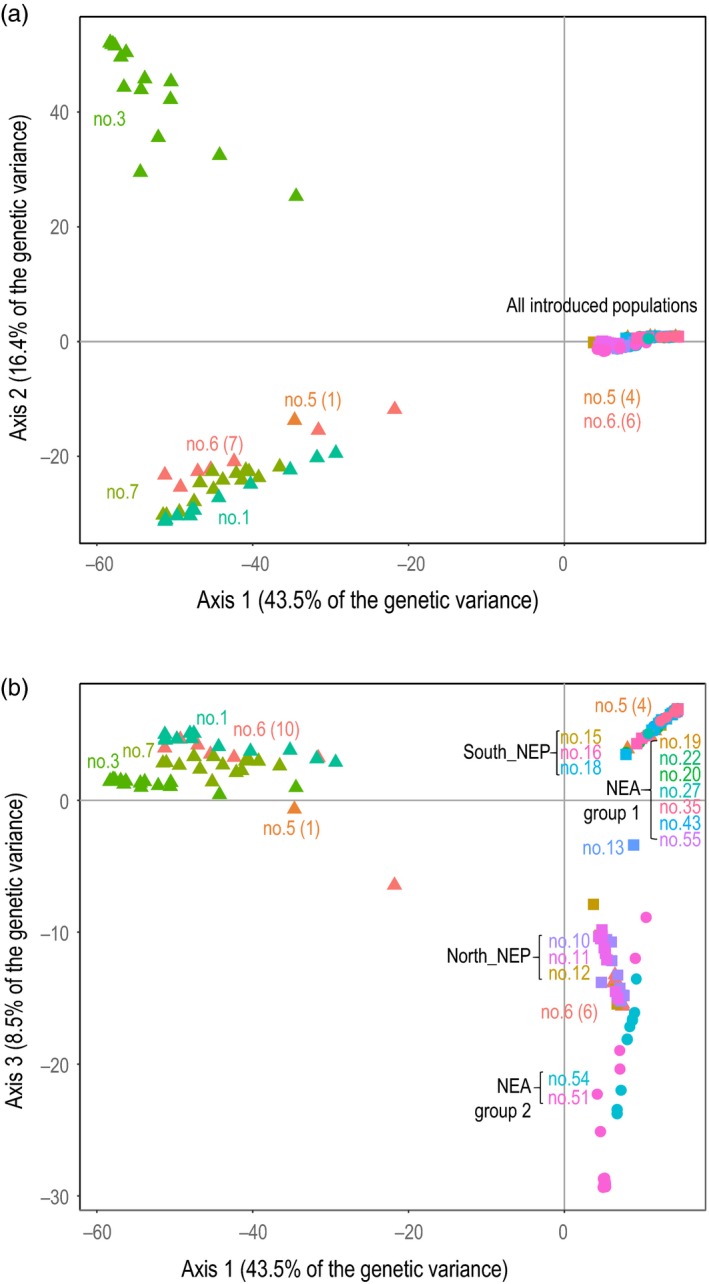
Principal component analysis (PCA), using the RAD‐seq dataset, showing individuals coordinates on the first two components (a) and on the first and third component (b). Colors refer to different regions and populations

Principal component analysis (PCA), using the RAD‐seq dataset, showing individuals coordinates on the first two components (a) and on the first and third component (b). Colors refer to different regions and populations