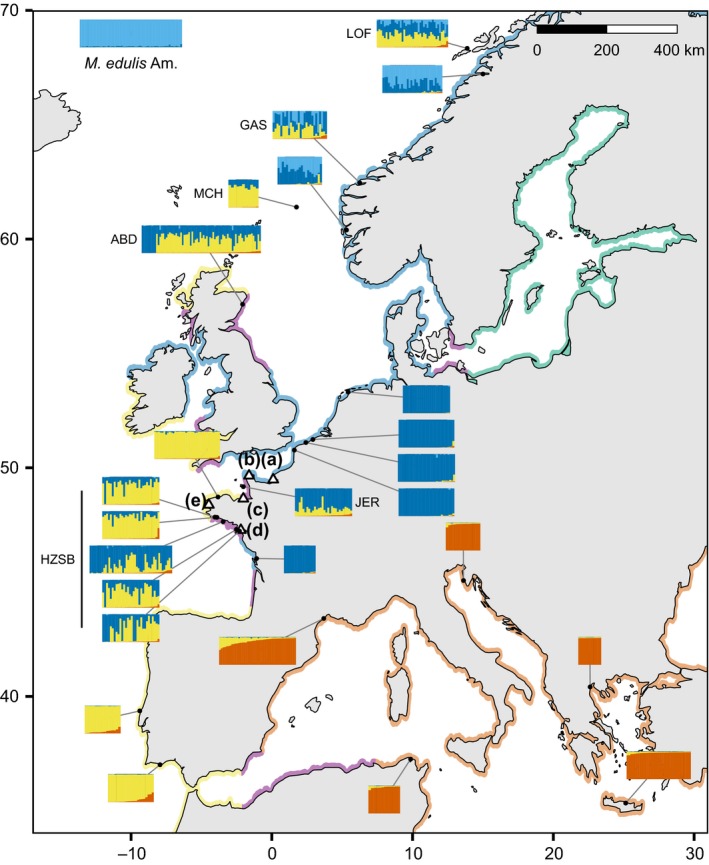
Figure 2.

Location and ancestry composition of sites for reference and admixed populations. Barplots represent ancestries of individuals from the focal site, estimated by Structure with K = 4. In all barplots, individuals have been sorted from left to right by their level of Mediterranean M. galloprovincialis ancestry. Coloured coastlines indicate the approximate distribution of parental genetic background, with colour code as used in Figure 1. Hybrid zones are coloured in purple. Points (a–e) correspond to the ports of Le Havre, Cherbourg, Saint‐Malo, Saint‐Nazaire and Brest respectively, which are detailed in Figure 3
