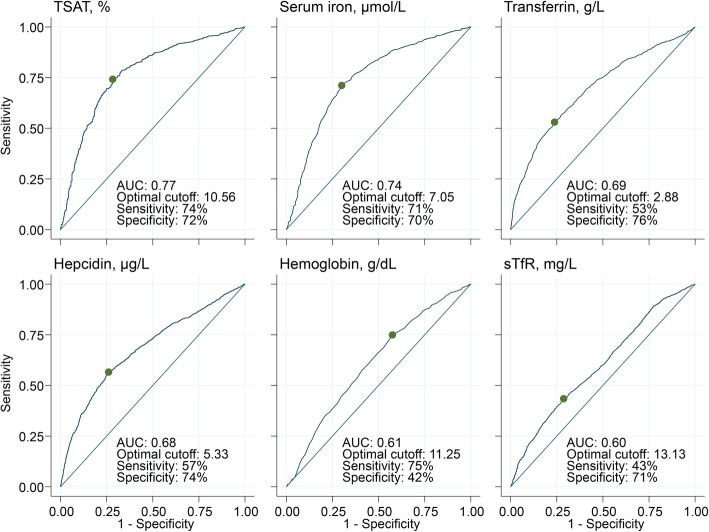
Fig. 6.
Receiver operating characteristic curves of the utility of iron markers in predicting regression-corrected iron deficiency. The “gold standard” was defined using the WHO definition adjusted for malaria and inflammation using regression correction. Green points indicate Youden’s optimal cut-offs for each marker. Sensitivity and specificity are for the optimal cut-off. TSAT, transferrin saturation; sTfR, soluble transferrin receptor; AUC, area under curve

