Figure 8.

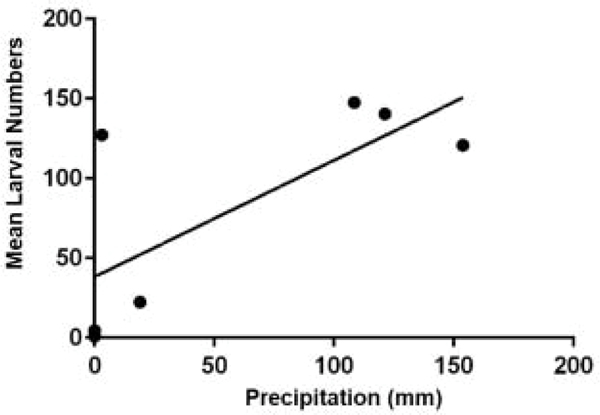
Regression graph suggesting a correlation between mean numbers of Rhipicephalus annulatus larvae collected from exposed habitats and precipitation in millimeters (p = 0.06, r2 = 0.52)

Regression graph suggesting a correlation between mean numbers of Rhipicephalus annulatus larvae collected from exposed habitats and precipitation in millimeters (p = 0.06, r2 = 0.52)