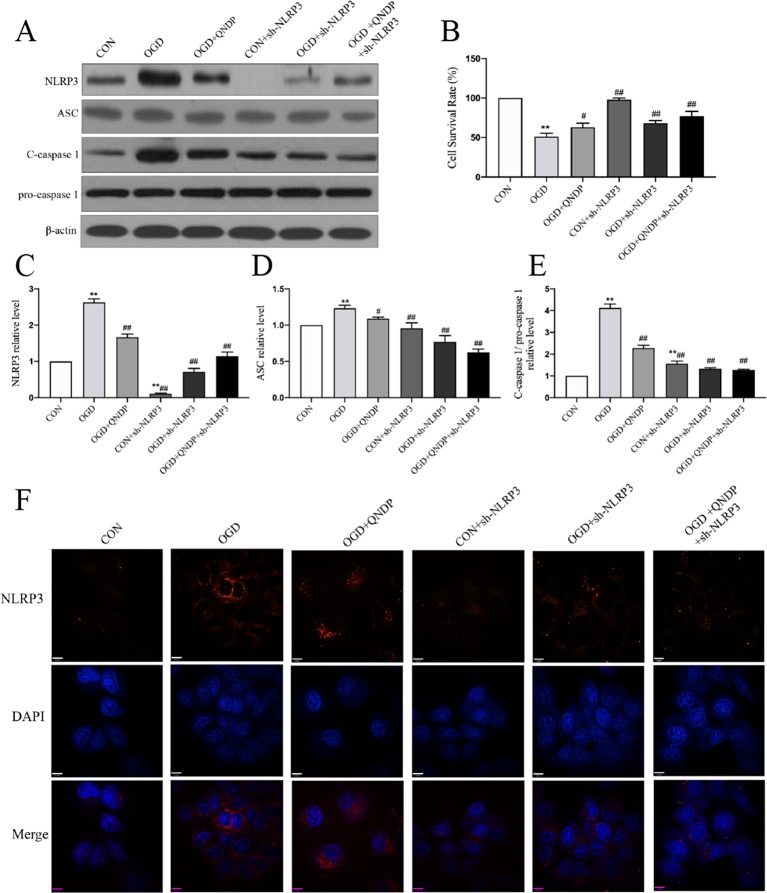
Figure 4.
Effect of QNDP on the expression of NLRP3, ASC, and cleaved caspase 1 following OGD in SH-SY5Y cells. (A) Western blotting bands of NLRP3, ASC, C-caspase 1, pro-caspase 1, (B) Cell survival rate using CCK-8 assay. Western blotting analysis of NLRP3 (C), ASC (D), C-caspase 1/pro-caspase 1 (E). (F) Immunocytochemical staining for NLRP3 (red), the nuclei were stained blue with DAPI. Scale bar indicates 10 μm. Data are presented as the mean ± SEM, n = 3-5 batches of cells, **p < 0.01 compared with the sham group, # p < 0.05, ## p < 0.01 compared with the MCAO group.

