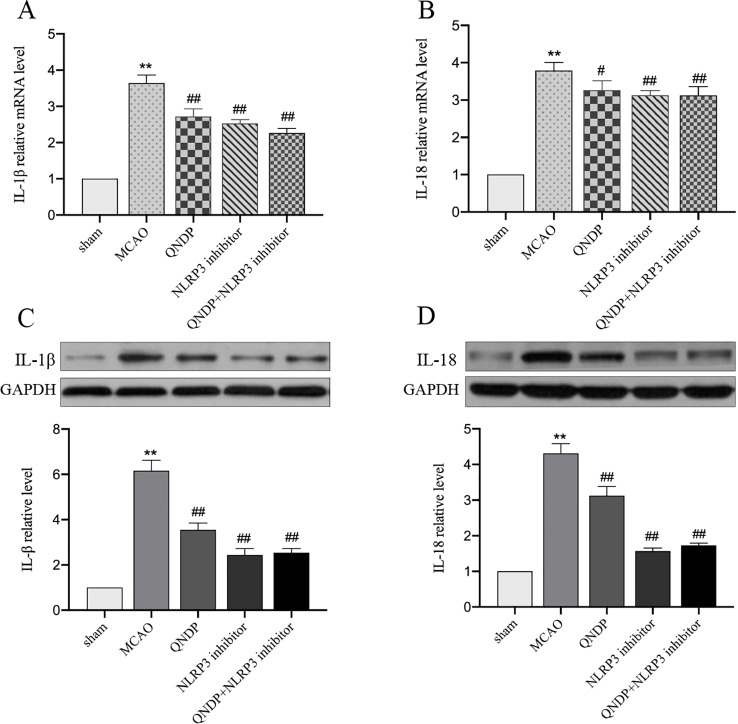
Figure 5.
Effect of QNDP on the expression of IL-1β and IL-18 in MCAO rats. Real- time PCR analysis of IL-1β (A), IL-18 (B). n = 8 per group. Western blotting analysis of IL-1β (C), IL-18 (D), n = 3 per group. Data are presented as the mean ± SEM, **p < 0.01 compared with the sham group, # p < 0.05, ## p < 0.01 compared with the MCAO group.

