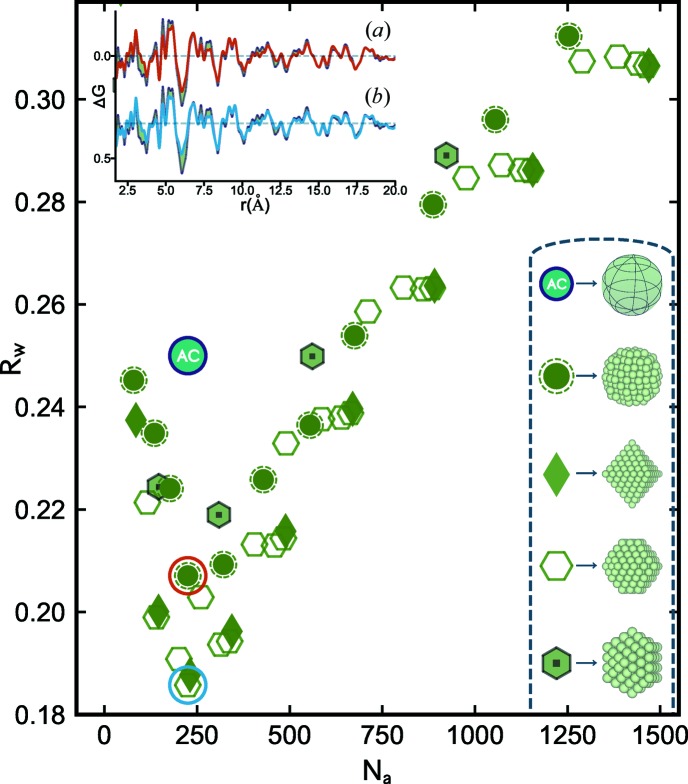
Figure 2.
Scatter plot of agreement factors (R w) for discrete f.c.c. clusters fitted to the Pd nanoparticle PDF, plotted as a function of the number of atoms per model (N a). Each point is an individual PDF refinement of a discrete structure from a different f.c.c. cluster type. These have been categorized as different families (see Section 2 for details) which are represented in the legend at the bottom right. From top to bottom, the five families from the f.c.c. motif shown here are AC, discrete spheres, regular octahedral, truncated octahedral and cuboctahedral. In the scatter plot, the AC model fit is marked as a solid teal circle, and the best-fit model from the discrete spherical and truncated octahedral families is highlighted with red and blue circles, respectively. In the inset to the top left, the PDF fit residual from the AC model (light purple) is overlaid with the difference curves from the aforementioned best-fit discrete sphere (a) and octahedral clusters (b), using the same colors as highlighted in the scatter plot.

