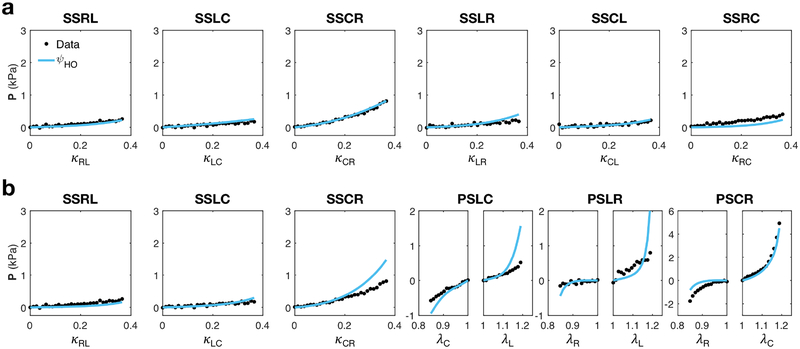
Figure 7:
Fit of the HO model (6) (blue line) to the triaxial data (black dots) for the (a) “All Simple Shear” and (b) “Optimal Triaxial” datasets. Results are shown for the relevant components of the first Piola-Kirchhoff stress tensor P as functions of the corresponding shear deformations.

