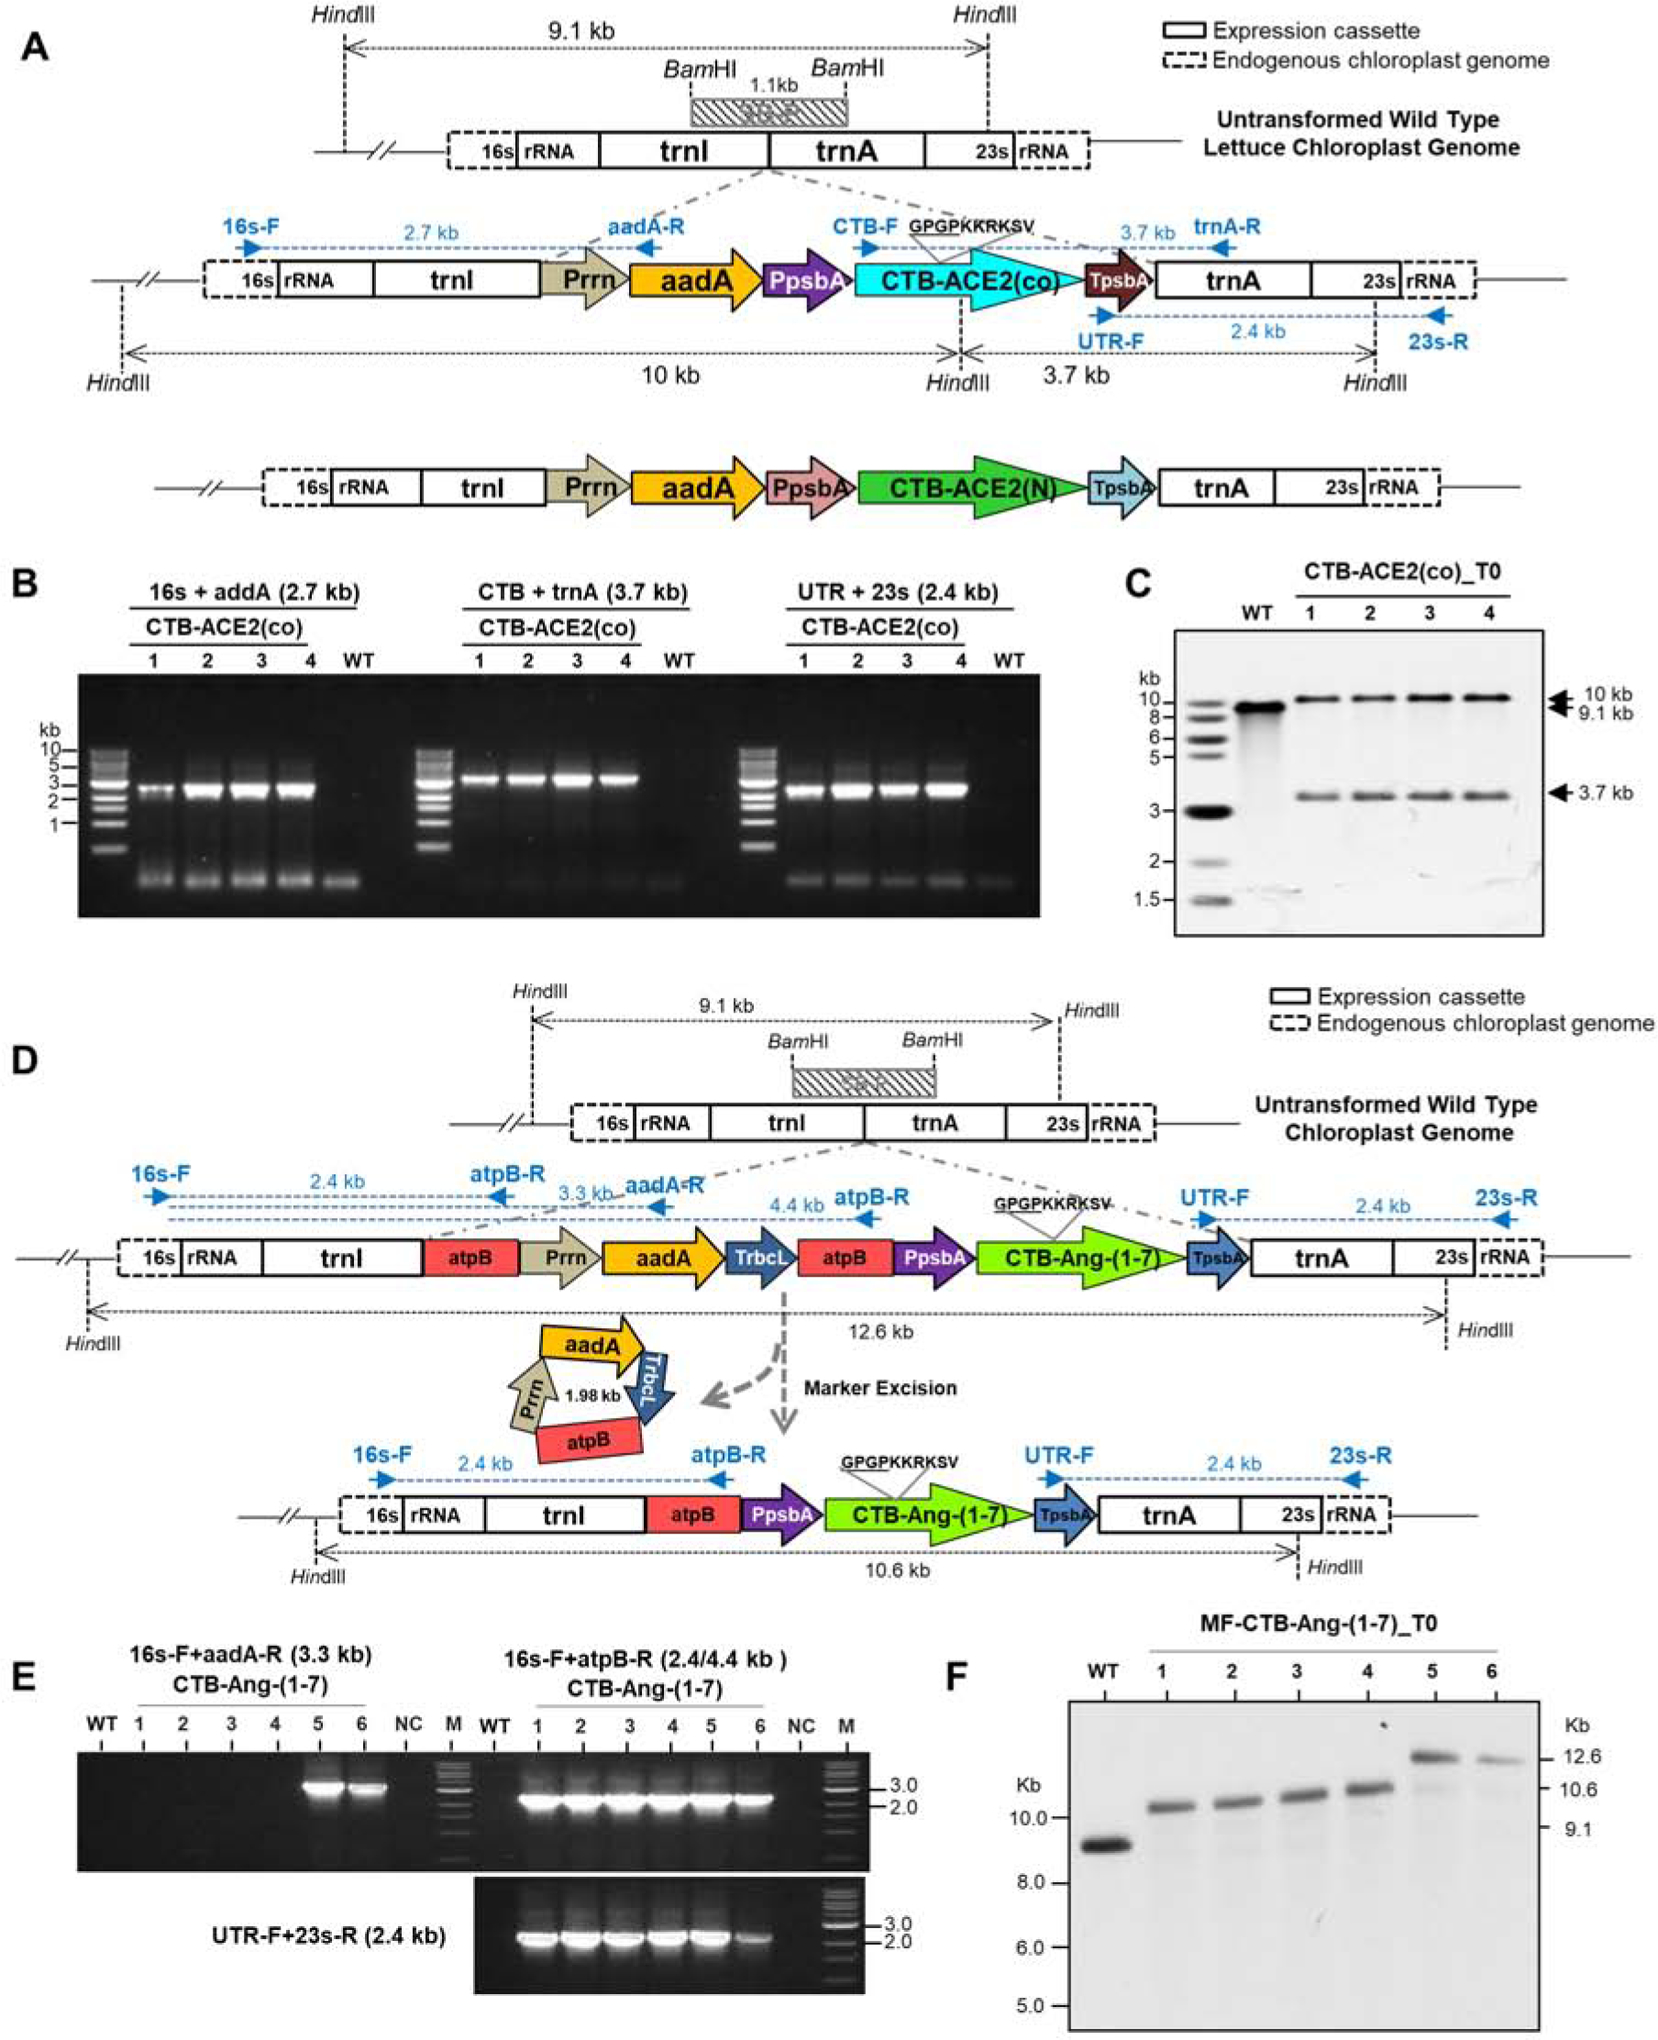
Fig. 1. Creation of transplastomic lettuce lines with stable integration of CTB-ACE2 and CTB-Ang-(1–7).

(A) Schematic diagram of chloroplast transformation vector map containing CTB-ACE2 expression cassette. 16s and 23s rRNA, 16s and 23s ribosomal RNA; trnI, isoleucyl-tRNA; trnA, alanyl-tRNA; Prrn, rRNA operon promoter; CTB-ACE2(co), codon optimized angiotensin converting enzyme2 with CTB (Cholera non-Toxin B subunit) fusion; TpsbA, 3´-UTR of psbA. Blue arrows show PCR primers annealing sites with expected amplified sizes. Diagram of native ACE2 in tobacco expression cassette is located at the bottom. SB-P, Southern blot probe. (B) Genomic DNA PCR amplification with three sets of primers. (C) Southern blot analysis of CTB-ACE2 transplastomic lines. Expected sizes are indicated in black arrows. (B-C) Lanes 1 to 4, individual lettuce transplastomic lines; WT, untransformed wild type. (D) Schematic diagram of CTB-Ang-(1–7) gene in expression cassette of lettuce chloroplast marker-free vector and process of marker excision. Ang-(1–7), Angiotensin-(1–7). SB-P, Southern blot probe. (E) PCR analysis with three sets of primers. WT, untransformed wild type; M; DNA standard, lanes 1 to 6, transplastomic lines. (F) Southern blot analysis for MF-CTB-Ang-(1–7) transplastomic lines. WT, untransformed wild type; lanes 1 to 6, transplastomic T0 seedlings. Expected sizes are indicated in arrows.
