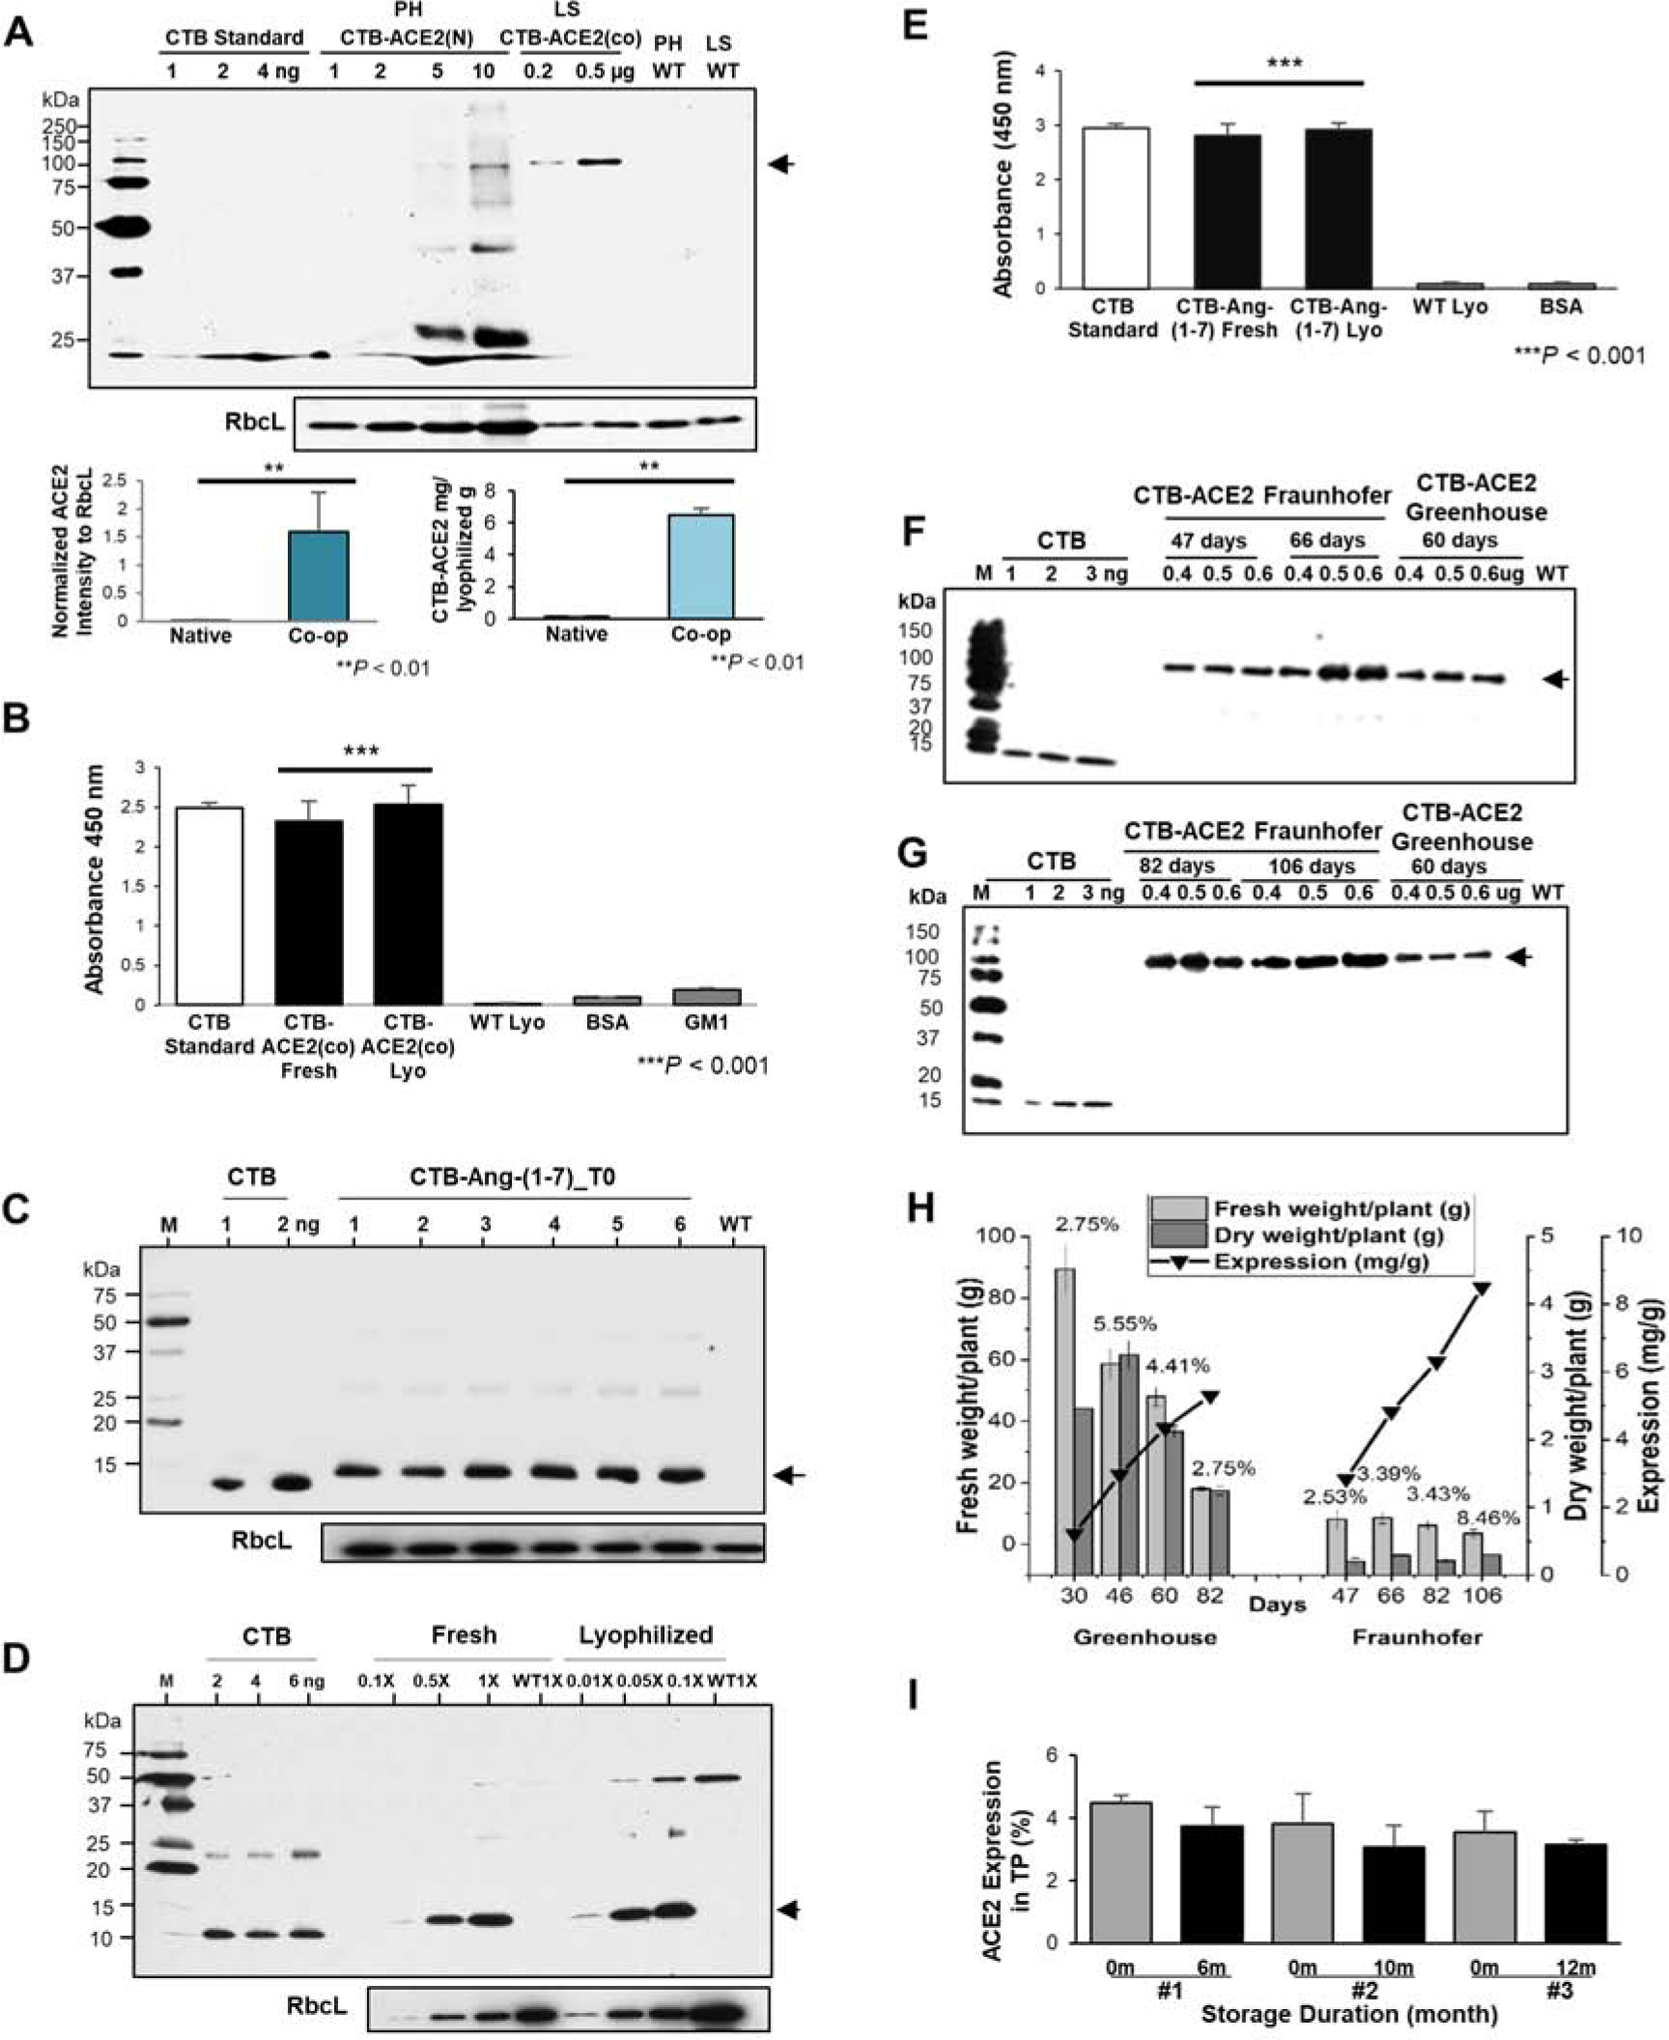
Fig. 2. Characterizations of CTB-ACE2(co) and CTB-Ang-(1–7) expression, stability, storage, and clinical grade production.

(A) Immunoblot analysis between native ACE2(N) and codon optimized ACE2(co). The bottom graph visualizes the mean ± SD of normalized ACE2 intensities to RbcL (loading controls) (bottom). **P-value < 0.01 vs. Native. PH, tobacco Petit Havana; LS, lettuce; WT, untransformed wild type; N, native sequence; CO, codon-optimized sequence. (C) Western blot of CTB-Ang-(1–7) T0 generation. Lanes #1 to 6, individual plant. (D) Western blot of CTB-Ang-(1–7) in equal amount of fresh and lyophilized plant cells (1X). (C-D) WT, untransformed wild type lettuce, M, protein standard; CTB, cholera non-toxic B subunit; Lyo, lyophilized lettuce. RbcL was used as loading controls. GM1 ELISA assay of (B) CTB-ACE2 and (E) CTB-Ang-(1–7) pentamer. WT, untransformed wild type; Lyo, lyophilized lettuce. Data are expressed as the mean ± SD. ***P-value < 0.001 vs. WT. The data obtained from two independent biological repeats run in triplicates. (F) Western blot analysis of ACE2 accumulation in transplastomic lettuce plants harvested from Fraunhofer hydroponically (FH) and Greenhouse (GH) with different times (F and G). Western blot was performed for different ages ranged from 46 days and 66 days for FH and 46 days for GH (F), 82 days and 106 days for FH and 60 days for GH (G); The amount of TP loaded is given above the respective lane in g. The arrows indicate the 100 kDa Ace2. M: spectra multicolour broad range protein ladder (Thermo Scientific, molecular weight of the marker bands indicated in kDa). (H) Determination of fresh weight, dry weight, ACE2 expression, and ACE2 yield per plant with different ages between Greenhouse and Fraunhofer. Plant ages are relative to the date of germination. Fresh and dry weight per plant are calculated by normalization of total fresh and dry weight to total number of plants grown in Greenhouse (16) and Fraunhofer (400). The percentage of water content (the ratio of dry material / fresh material) are shown on the top of column. (I) Stability of CTB-ACE2 after long-term storage. #1 to #3, individual lettuce CTB-ACE2(co) transplastomic lines. Data are expressed as the mean ± SD.
