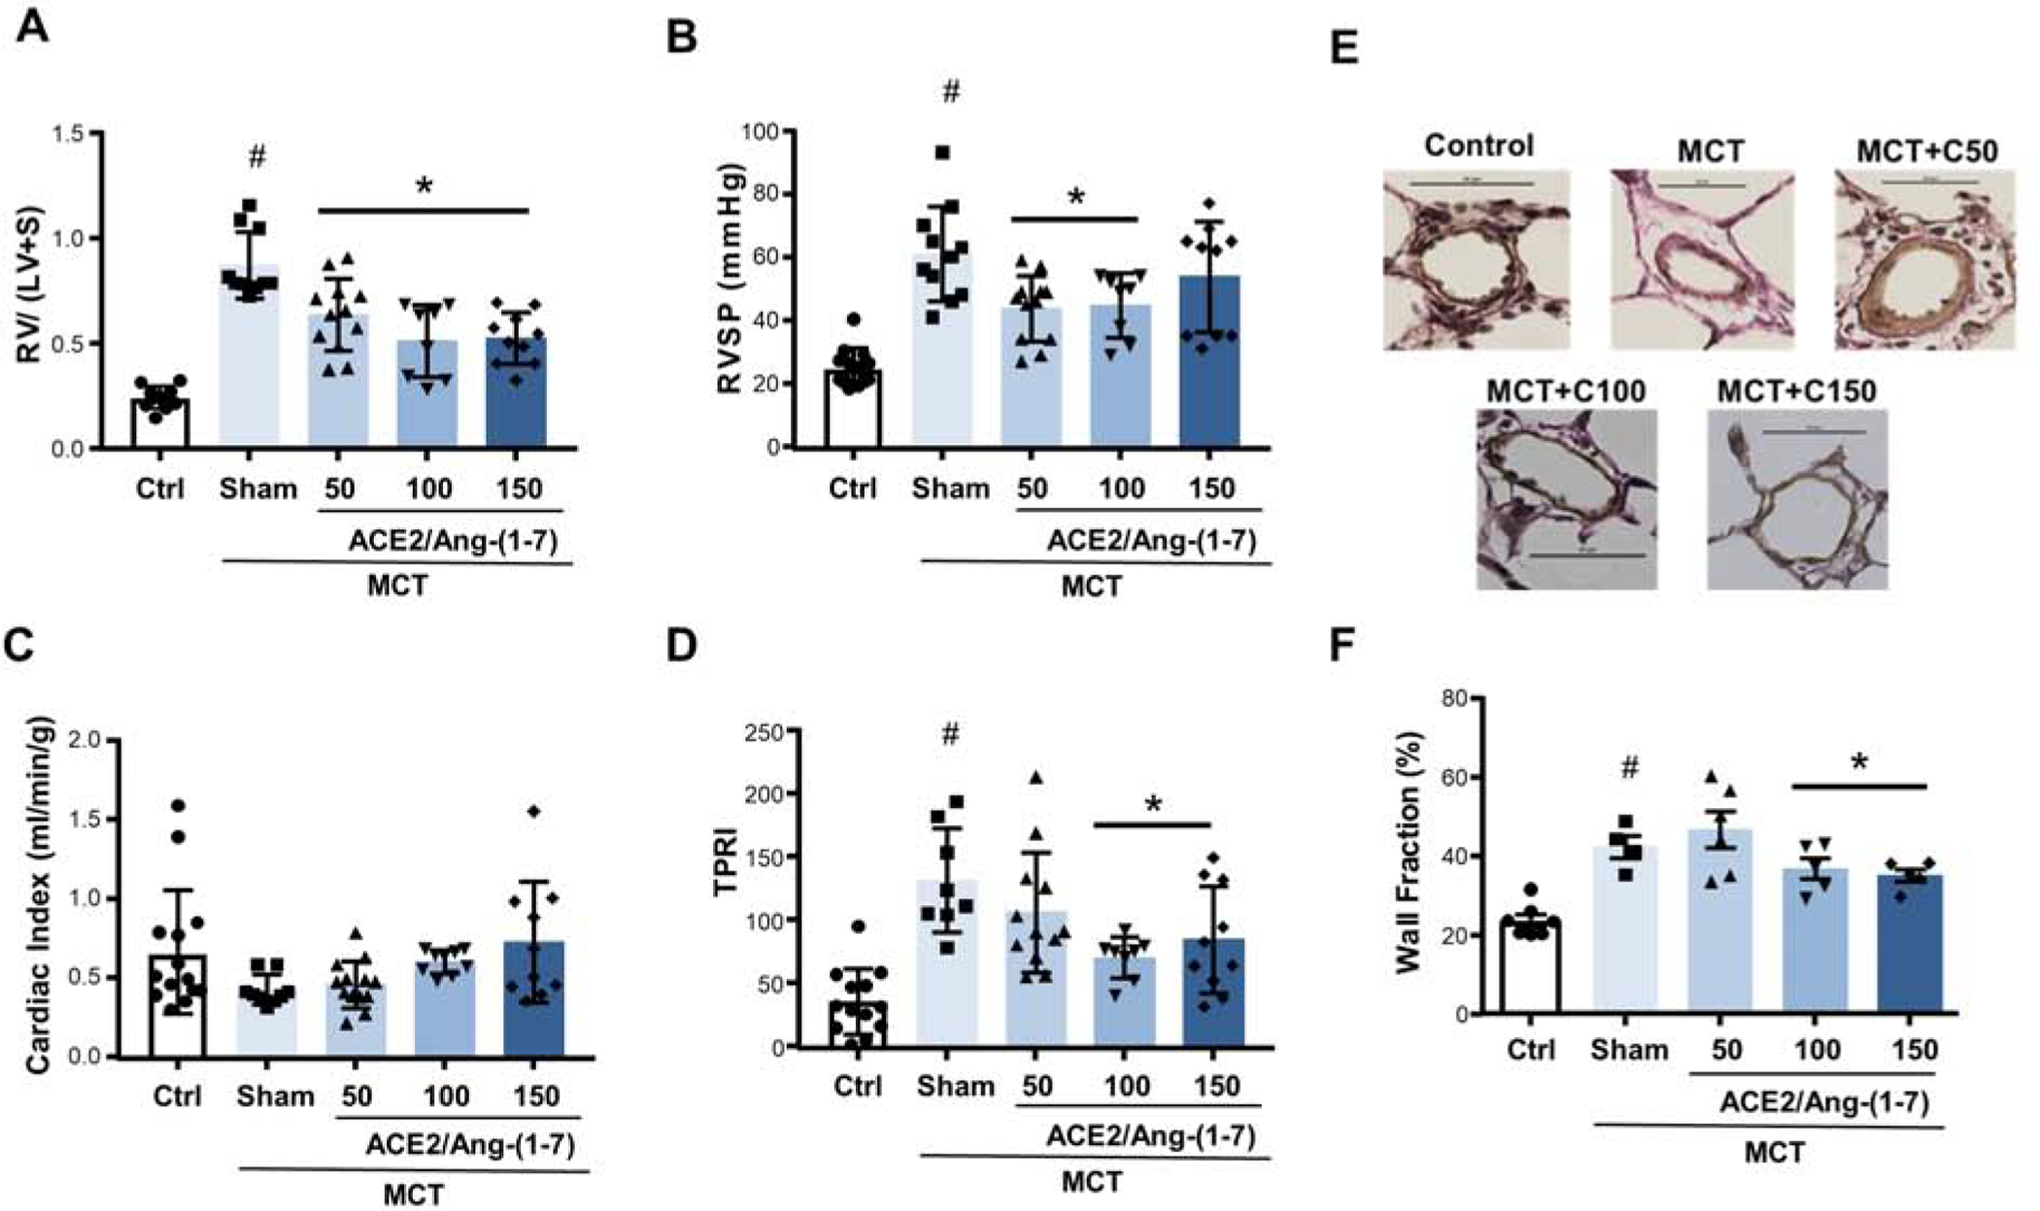
Fig. 5. Attenuation of experimental pulmonary hypertension by combinational feeding with bioencapsulated CTB-ACE2 and CTB-Ang-(1–7).

Effects of bioencapsulated CTB-ACE2 and CTB-Ang-(1–7) on (A) Fulton index (a marker of RV hypertrophy; calculated as the ratio of the right ventricle [RV] weight to the weight of the left ventricle plus septum [LV+S], (B) RV systolic pressure (RVSP), (C) cardiac index (CI; determined echocardiographically), (D) total pulmonary resistance index (TPRI [a marker of RV afterload]; calculated as ratio of RVSP and CI), and (E) pulmonary vascular remodeling (quantified as percent wall area). Representative photomicrographs of peripheral pulmonary arteries (Verhoeff-van Giesson stain) are shown on the bottom of (E); quantification of percent wall area is shown on right. CTB-ACE2, CTB-Ang-(1–7) or PBS were administered as outlined in Figure 4. Each data point represents one animal. Values are means ± SEM. #p <0.05 vs. control, *p <0.05 vs. sham by one-way ANOVA and post-hoc Newman-Keuls test. Ctrl = untreated control; MCT = monocrotaline.
