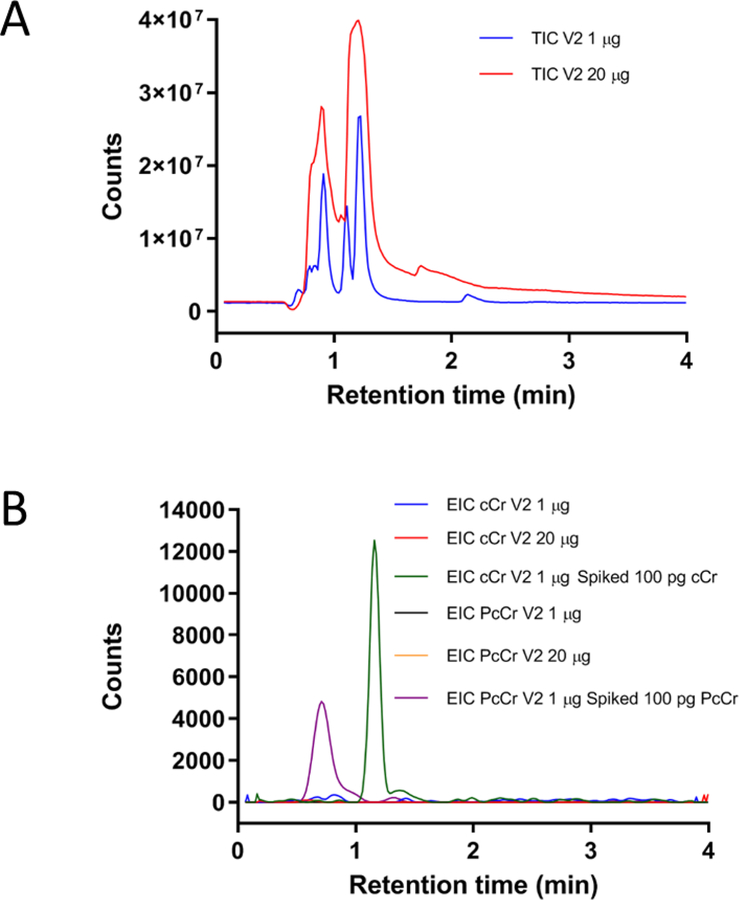
Figure 4.
HPLC-TOF MS analysis of Vendor 2 (V2) product. (A) TIC of V2 product injected at two different volumes: 1 μg (blue) and 20 μg (red); (B) EIC comparison of cyclocreatine (4) and phosphocyclocreatine (5) injections: 1 μg of stock V2 sample (blue, cCr; black, PcCr), 20 μg of stock V2 sample (red, cCr; orange, PcCr), and 1 μg of stock sample spiked with 100 pg of the cCr standard (green) and 100 pg of the PcCr standard (purple). The ion extraction based on the m/z of 144.0768 for cCr and m/z of 224.0431 for PcCr were within 20 ppm tolerance.

