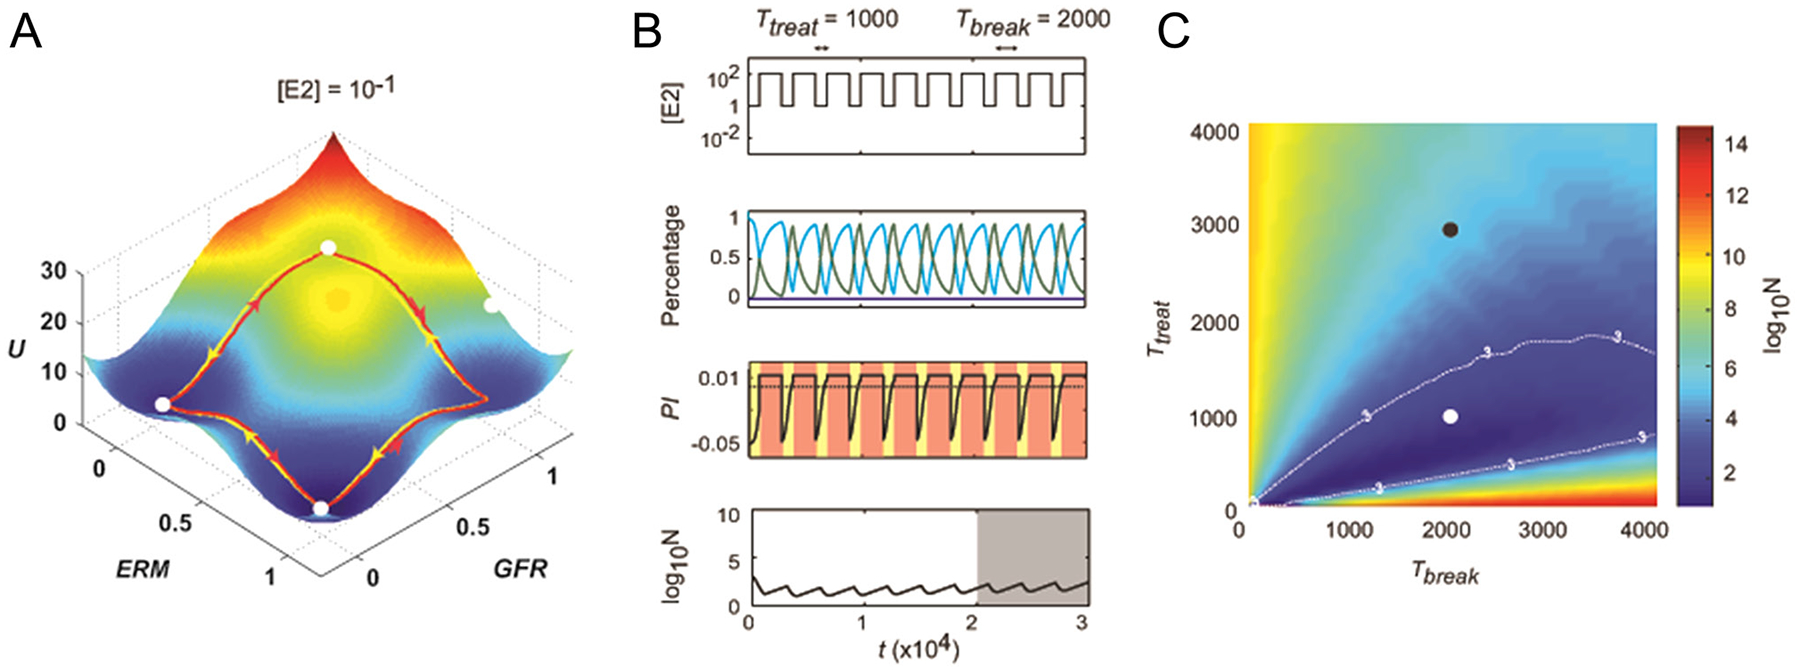
Figure 3.

(A) The estrogen-response landscape for a particular level of estrogen stimulation. There are four basins of attraction for the cell state corresponding to sensitive (ERM−/GFR−), hypersensitive (ERM+/GFR−) and independent (GFR+). (B) A sample intermittent treatment regimen (top panel) produces varying proportion of cells in different states (second panel; cyan = sensitive, green = hypersensitive, blue = independent), a varying proliferation index of the overall cell population (third panel; yellow indicates death and red indicates growth). The overall population level, starting from 1000 cells, is shown in the bottom panel. (C) Plot of the average value of cell number <log10 N> over the interval t ϵ (2 × 10⁴, 3 × 10⁴) as a function of Ttreat and Tbreak. The white dot indicates the case in (B). Any combination of Ttreat and Tbreak that puts the system within the log10N = 3 contour will suppress cancer growth. This figure is adapted, with permission, from Fig. 3 and 6 of Chen et al. (2014).
