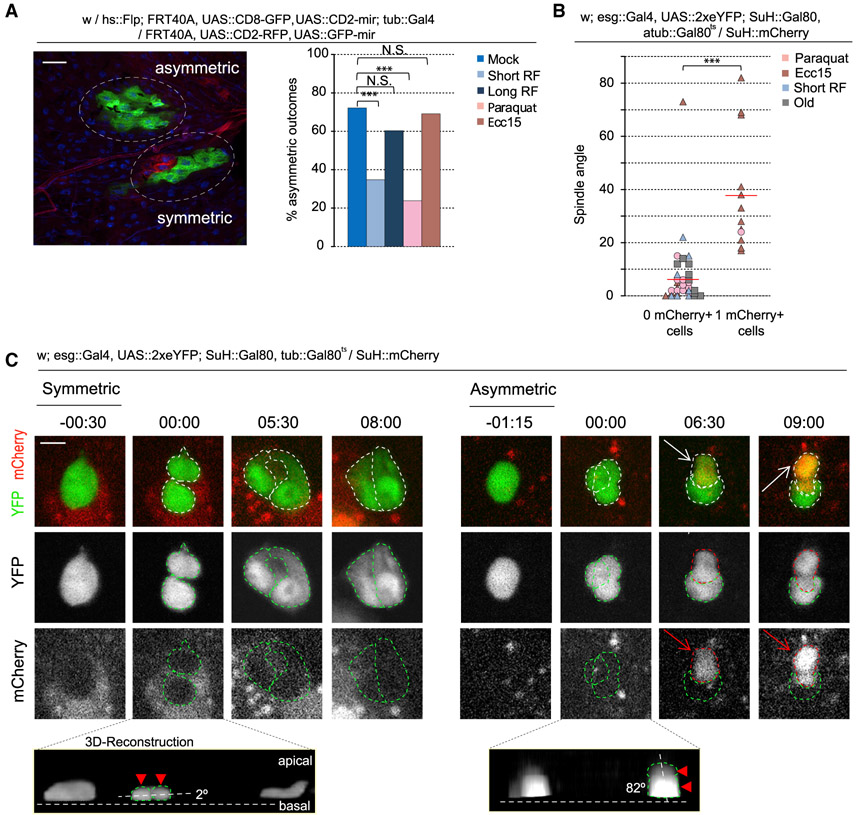
Figure 2. Spindle Orientation Is an Indicator of Cell Fate.
(A) Quantification and representative image of twin-spot clones.
(B and C) Quantification (B) and montage (C) of symmetric versus asymmetric outcomes after live imaging of ex vivo intestines. Telophase-cytokinesis was set at 00:00 (hours:minutes). During a symmetric outcome, the dividing cell (−00:30–00:00) forms two daughter cells that remain mCherry− for the duration of the video (08:00). During an asymmetric outcome, the dividing cell (−01:15–00:00) forms two daughter cells. One of the daughter cells remains mCherry−, whereas the other daughter cell becomes mCherry+ (arrow, 06:30). Cell bodies are outlined with green for mCherry− and red for mCherry+. Insets depict 3D reconstruction of the two segregating cell bodies (arrowhead and outlined).
Mean ± SD; n = 133 (young), 112 (short-term refeed), 63 (long-term refeed), 42 (paraquat), and 84 (Ecc15) clones from ≥ 10 flies per condition (A), with spindle orientation quantified from 26 flies (B); N.S., not significant; ***p < 0.001, based on a chi-square test (A) or Mann-Whitney test (B). Red bar, mean (B). Scale bars, 20 μm (A) and 5 μm (C).
See also Figures S2-S4 and Videos S3, S4, S5, S6, S7, and S8.

