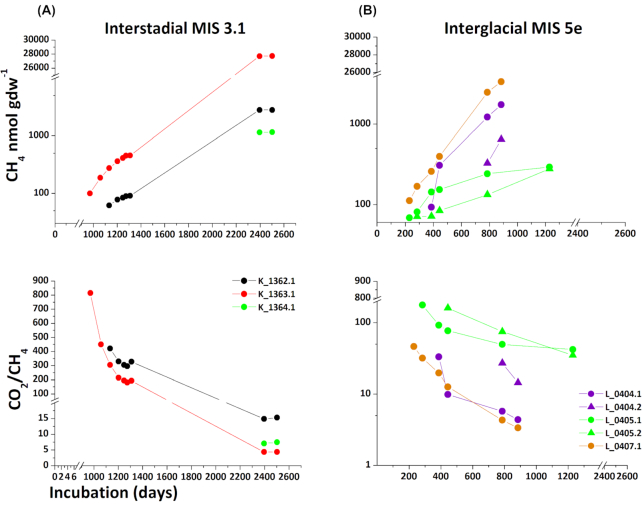
Figure 2.
Cumulative methane production (nmol CH4 gdw-1) and ratios of CO2 and methane over the incubation period (days). Panel A and B present deposits with active methanogenesis; A) interstadial MIS 3.1 and B) interglacial, Eemian, MIS 5e. Methane production after a threshold of 50 nmol CH4 gdw-1 is presented.

