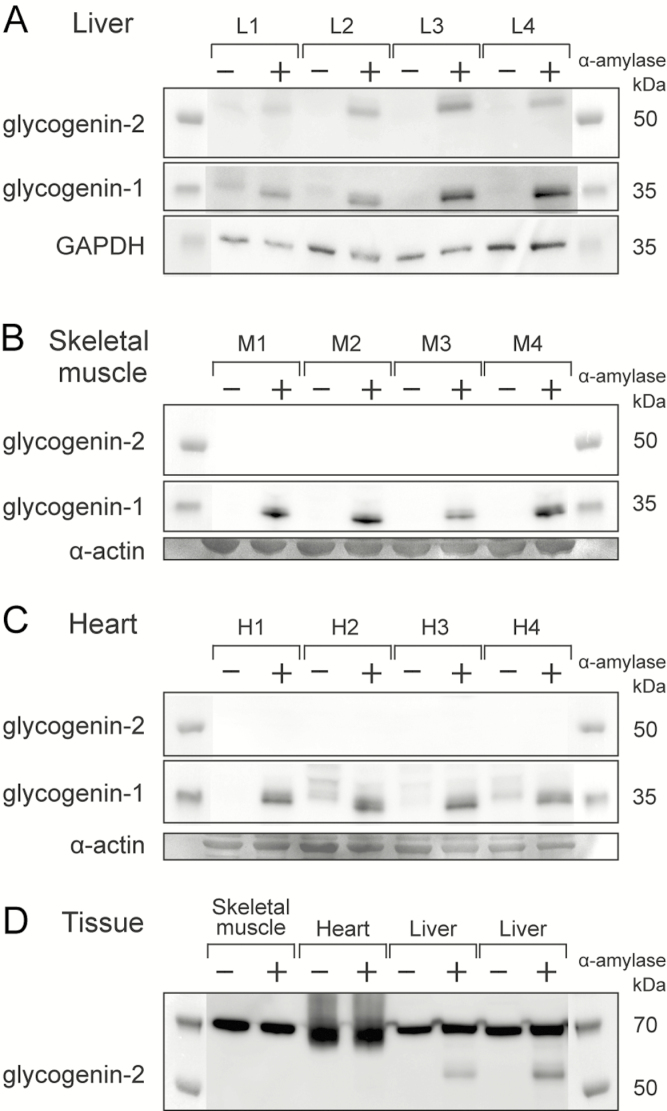
Figure 2.
Western blot analysis of glycogenin-1 and glycogenin-2 in control tissues. A, In liver controls (L1-L4), glycogenin-1 and glycogenin-2 both were detectable after α-amylase treatment (+). B, In skeletal muscle (M1-M4), only glycogenin-1, but not glycogenin-2, was detectable after α-amylase treatment (+). C, In heart (H1-H4), glycogenin-1, but not glycogenin-2, was detectable after α-amylase treatment (+) and to some degree, even without any α-amylase treatment (–). The slightly larger size (≈1 kDa) of the glycogenin-1 without α-amylase treatment indicates that there was a small amount of functional, autoglucosylated glycogenin-1 in the heart that was not embedded in glycogen molecules. D, A panel of 3 different tissues (heart, skeletal muscle, and liver). A band corresponding to glycogenin-2 and appearing only after α-amylase treatment is present in the liver only. Glycogenin-2 peptides were identified by mass spectrometry (MS) in the gel in the same region, but only in the liver. All tissues show a band at around 70 kDa that is equally strong with or without α-amylase treatment. No glycogenin-2 peptides were identified by MS in gel pieces cut from this region. Loading controls were α-actin (skeletal muscle and heart panels) from gels stained with Coomassie blue (SimplyBlue SafeStain,Thermo Fisher Scientific). GAPDH indicates glyceraldehyde-3-phosphate dehydrogenase.

